Citibank 2009 Annual Report Download - page 216
Download and view the complete annual report
Please find page 216 of the 2009 Citibank annual report below. You can navigate through the pages in the report by either clicking on the pages listed below, or by using the keyword search tool below to find specific information within the annual report.-
 1
1 -
2
-
3
-
4
-
5
-
6
-
7
-
8
-
9
-
10
-
11
-
12
-
13
-
14
-
15
-
16
-
17
-
18
-
19
-
20
-
21
-
22
-
23
-
24
-
25
-
26
-
27
-
28
-
29
-
30
-
31
-
32
-
33
-
34
-
35
-
36
-
37
-
38
-
39
-
40
-
41
-
42
-
43
-
44
-
45
-
46
-
47
-
48
-
49
-
50
-
51
-
52
-
53
-
54
-
55
-
56
-
57
-
58
-
59
-
60
-
61
-
62
-
63
-
64
-
65
-
66
-
67
-
68
-
69
-
70
-
71
-
72
-
73
-
74
-
75
-
76
-
77
-
78
-
79
-
80
-
81
-
82
-
83
-
84
-
85
-
86
-
87
-
88
-
89
-
90
-
91
-
92
-
93
-
94
-
95
-
96
-
97
-
98
-
99
-
100
-
101
-
102
-
103
-
104
-
105
-
106
-
107
-
108
-
109
-
110
-
111
-
112
-
113
-
114
-
115
-
116
-
117
-
118
-
119
-
120
-
121
-
122
-
123
-
124
-
125
-
126
-
127
-
128
-
129
-
130
-
131
-
132
-
133
-
134
-
135
-
136
-
137
-
138
-
139
-
140
-
141
-
142
-
143
-
144
-
145
-
146
-
147
-
148
-
149
-
150
-
151
-
152
-
153
-
154
-
155
-
156
-
157
-
158
-
159
-
160
-
161
-
162
-
163
-
164
-
165
-
166
-
167
-
168
-
169
-
170
-
171
-
172
-
173
-
174
-
175
-
176
-
177
-
178
-
179
-
180
-
181
-
182
-
183
-
184
-
185
-
186
-
187
-
188
-
189
-
190
-
191
-
192
-
193
-
194
-
195
-
196
-
197
-
198
-
199
-
200
-
201
-
202
-
203
-
204
-
205
-
 206
206 -
 207
207 -
 208
208 -
 209
209 -
 210
210 -
 211
211 -
 212
212 -
 213
213 -
 214
214 -
 215
215 -
 216
216 -
 217
217 -
 218
218 -
 219
219 -
 220
220 -
 221
221 -
 222
222 -
 223
223 -
 224
224 -
 225
225 -
 226
226 -
227
-
228
-
229
-
230
-
231
-
232
-
233
-
234
-
235
-
236
-
237
-
238
-
239
-
240
-
241
-
242
-
243
-
244
-
245
-
246
-
247
-
248
-
249
-
250
-
251
-
252
-
253
-
254
-
255
-
256
-
257
-
258
-
259
-
260
-
261
-
262
-
263
-
264
-
265
-
266
-
267
-
268
-
269
-
270
-
271
-
272
-
273
-
274
-
275
-
276
-
277
-
278
-
279
-
280
-
281
-
282
-
283
-
284
 |
 |

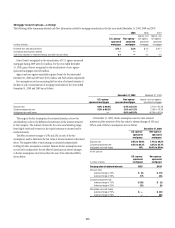
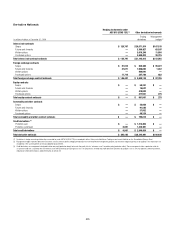
206
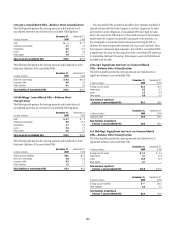
Mortgage Securitizations—Citi Holdings
The following tables summarize selected cash flow information related to mortgage securitizations for the years ended December 31, 2009, 2008 and 2007:
2009 2008 2007
In billions of dollars
U.S. agency-
sponsored
mortgages
Non-agency-
sponsored
mortgages
Agency- and
non-agency-
sponsored
mortgages
Agency- and
non-agency-
sponsored
mortgages
Proceeds from new securitizations $70.1 $ — $81.7 $107.2
Contractual servicing fees received 1.3 0.1 1.4 1.7
Cash flows received on retained interests and other net cash flows 0.3 0.1 0.7 0.3
The Company did not recognize gains (losses) on the securitization
of U.S. agency- and non-agency-sponsored mortgages in the year ended
December 31, 2009. There were gains from the securitization of agency- and
non-agency-sponsored mortgages of $73 million and $(27) million in the
years ended December 31, 2008 and 2007, respectively.
Key assumptions used in measuring the fair value of retained interests at
the date of sale or securitization of mortgage receivables for the years ended
December 31, 2009 and 2008 are as follows:
2009 2008
U.S. agency-
sponsored mortgages
Non-agency-
sponsored mortgages
Agency- and non-agency-
sponsored mortgages
Discount rate 7.9% to 15.0% N/A 4.5% to 18.2%
Constant prepayment rate 2.8% to 18.2% N/A 3.6% to 32.9%
Anticipated net credit losses 0.0% to 0.1% N/A —
N/A Not applicable
The range in the key assumptions for retained interests in Special Asset
Pool and Local Consumer Lending is due to the different characteristics of
the interests retained by the Company. The interests retained by Securities
and Banking range from highly rated and/or senior in the capital structure
to unrated and/or residual interests.
The effect of adverse changes of 10% and 20% in each of the key
assumptions used to determine the fair value of retained interests is disclosed
below. The negative effect of each change is calculated independently,
holding all other assumptions constant. Because the key assumptions may
not in fact be independent, the net effect of simultaneous adverse changes in
the key assumptions may be less than the sum of the individual effects shown
below.
At December 31, 2009, the key assumptions used to value retained
interests and the sensitivity of the fair value to adverse changes of 10% and
20% in each of the key assumptions were as follows:
December 31, 2009
U.S. agency-
sponsored
mortgages
Non-agency-
sponsored
mortgages
Discount rate 11.9% 1.4% to 44.1%
Constant prepayment rate 12.6% 5.0% to 32.8%
Anticipated net credit losses 0.1% 0.3% to 70.0%
Weighted average life 6.5 years 0.1 to 9.4 years
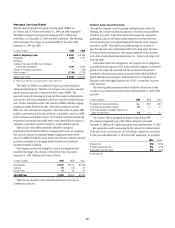
In millions of dollars
U.S. agency-
sponsored
mortgages
Non-agency-
sponsored
mortgages
Carrying value of retained interests $ 6,273 $ 992
Discount rates
Adverse change of 10% $ (227) $ (38)
Adverse change of 20% (439) (74)
Constant prepayment rate
Adverse change of 10% $ (322) $ (41)
Adverse change of 20% (622) (83)
Anticipated net credit losses
Adverse change of 10% $ (12) $ (45)
Adverse change of 20% (25) (88)