Citibank 2009 Annual Report Download - page 26
Download and view the complete annual report
Please find page 26 of the 2009 Citibank annual report below. You can navigate through the pages in the report by either clicking on the pages listed below, or by using the keyword search tool below to find specific information within the annual report.-
 1
1 -
2
-
3
-
4
-
5
-
6
-
7
-
8
-
9
-
10
-
11
-
12
-
13
-
14
-
15
-
 16
16 -
 17
17 -
 18
18 -
 19
19 -
 20
20 -
 21
21 -
 22
22 -
 23
23 -
 24
24 -
 25
25 -
 26
26 -
 27
27 -
 28
28 -
 29
29 -
 30
30 -
 31
31 -
 32
32 -
 33
33 -
 34
34 -
 35
35 -
 36
36 -
37
-
38
-
39
-
40
-
41
-
42
-
43
-
44
-
45
-
46
-
47
-
48
-
49
-
50
-
51
-
52
-
53
-
54
-
55
-
56
-
57
-
58
-
59
-
60
-
61
-
62
-
63
-
64
-
65
-
66
-
67
-
68
-
69
-
70
-
71
-
72
-
73
-
74
-
75
-
76
-
77
-
78
-
79
-
80
-
81
-
82
-
83
-
84
-
85
-
86
-
87
-
88
-
89
-
90
-
91
-
92
-
93
-
94
-
95
-
96
-
97
-
98
-
99
-
100
-
101
-
102
-
103
-
104
-
105
-
106
-
107
-
108
-
109
-
110
-
111
-
112
-
113
-
114
-
115
-
116
-
117
-
118
-
119
-
120
-
121
-
122
-
123
-
124
-
125
-
126
-
127
-
128
-
129
-
130
-
131
-
132
-
133
-
134
-
135
-
136
-
137
-
138
-
139
-
140
-
141
-
142
-
143
-
144
-
145
-
146
-
147
-
148
-
149
-
150
-
151
-
152
-
153
-
154
-
155
-
156
-
157
-
158
-
159
-
160
-
161
-
162
-
163
-
164
-
165
-
166
-
167
-
168
-
169
-
170
-
171
-
172
-
173
-
174
-
175
-
176
-
177
-
178
-
179
-
180
-
181
-
182
-
183
-
184
-
185
-
186
-
187
-
188
-
189
-
190
-
191
-
192
-
193
-
194
-
195
-
196
-
197
-
198
-
199
-
200
-
201
-
202
-
203
-
204
-
205
-
206
-
207
-
208
-
209
-
210
-
211
-
212
-
213
-
214
-
215
-
216
-
217
-
218
-
219
-
220
-
221
-
222
-
223
-
224
-
225
-
226
-
227
-
228
-
229
-
230
-
231
-
232
-
233
-
234
-
235
-
236
-
237
-
238
-
239
-
240
-
241
-
242
-
243
-
244
-
245
-
246
-
247
-
248
-
249
-
250
-
251
-
252
-
253
-
254
-
255
-
256
-
257
-
258
-
259
-
260
-
261
-
262
-
263
-
264
-
265
-
266
-
267
-
268
-
269
-
270
-
271
-
272
-
273
-
274
-
275
-
276
-
277
-
278
-
279
-
280
-
281
-
282
-
283
-
284
 |
 |

16
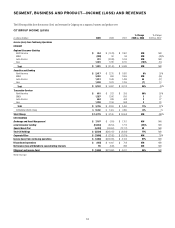
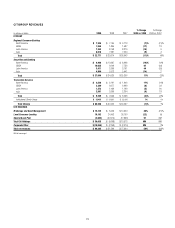
CITICORP
Citicorp is the company’s global bank for consumers and businesses and represents Citi’s core franchise. Citicorp is focused on providing best-in-class products
and services to customers and leveraging Citigroup’s unparalleled global network. Citicorp is physically present in nearly 100 countries, many for over 100 years,
and offers services in over 140 countries. Citi believes this global network provides a strong foundation for servicing the broad financial services needs of large
multinational clients and for meeting the needs of retail, private banking and commercial customers around the world. Citigroup’s global footprint provides
coverage of the world’s emerging economies, which the company believes represents a strong area of growth. As discussed in the “Executive Summary,” Citicorp
remained profitable in 2008 and 2009, despite very difficult market conditions. At December 31, 2009, Citicorp had approximately $1.1 trillion of assets and
$731 billion of deposits, representing approximately 60% of Citi’s total assets and approximately 90% of its deposits.
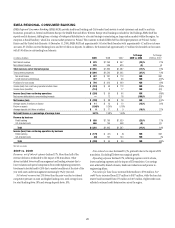
Citicorp consists of the following businesses: Regional Consumer Banking (which includes retail banking and Citi-branded cards in four regions—North
America, EMEA, Latin America and Asia) and Institutional Clients Group (which includes Securities and Banking and Transaction Services).
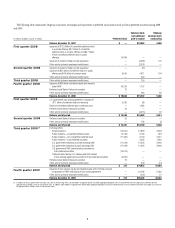
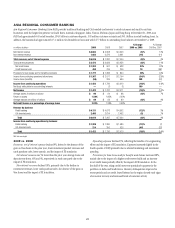
In millions of dollars 2009 2008 2007
% Change
2009 vs. 2008
% Change
2008 vs. 2007
Net interest revenue $ 33,263 $ 33,970 $ 25,600 (2)% 33%
Non-interest revenue 26,943 26,585 34,497 1(23)
Total revenues, net of interest expense $ 60,206 $ 60,555 $ 60,097 (1)% 1%
Provisions for credit losses and for benefits and claims
Net credit losses $ 6,079 $ 4,941 $ 2,700 23% 83%
Credit reserve build 2,562 3,219 1,069 (20) NM
Provision for loan losses $ 8,641 $ 8,160 $ 3,769 6% NM
Provision for benefits and claims 48 6 16 NM (63)%
Provision for unfunded lending commitments 138 (191) 79 NM NM
Total provisions for credit losses and for benefits and claims $ 8,827 $ 7,975 $ 3,864 11% NM
Total operating expenses $ 31,725 $ 43,533 $ 36,437 (27)% 19%
Income from continuing operations before taxes $ 19,654 $ 9,047 $ 19,796 NM (54)%
Provisions for income taxes 4,875 2,882 5,238 69% (45)
Income from continuing operations $ 14,779 $ 6,165 $ 14,558 NM (58)%
Net income attributable to noncontrolling interests 68 29 63 NM (54)
Citicorp’s net income $ 14,711 $ 6,136 $ 14,495 NM (58)%
Balance sheet data (in billions of dollars)
Total EOP assets $ 1,079 $ 1,002 $ 1,222 8% (18)%
Average assets $ 1,035 $ 1,256 $ 1,353 (18)% (7)%
Total EOP deposits $ 731 $ 673 $ 733 9% (8)%
NM Not meaningful