Citibank 2009 Annual Report Download - page 47
Download and view the complete annual report
Please find page 47 of the 2009 Citibank annual report below. You can navigate through the pages in the report by either clicking on the pages listed below, or by using the keyword search tool below to find specific information within the annual report.-
 1
1 -
2
-
3
-
4
-
5
-
6
-
7
-
8
-
9
-
10
-
11
-
12
-
13
-
14
-
15
-
16
-
17
-
18
-
19
-
20
-
21
-
22
-
23
-
24
-
25
-
26
-
27
-
28
-
29
-
30
-
31
-
32
-
33
-
34
-
35
-
36
-
 37
37 -
 38
38 -
 39
39 -
 40
40 -
 41
41 -
 42
42 -
 43
43 -
 44
44 -
 45
45 -
 46
46 -
 47
47 -
 48
48 -
 49
49 -
 50
50 -
 51
51 -
 52
52 -
 53
53 -
 54
54 -
 55
55 -
 56
56 -
 57
57 -
58
-
59
-
60
-
61
-
62
-
63
-
64
-
65
-
66
-
67
-
68
-
69
-
70
-
71
-
72
-
73
-
74
-
75
-
76
-
77
-
78
-
79
-
80
-
81
-
82
-
83
-
84
-
85
-
86
-
87
-
88
-
89
-
90
-
91
-
92
-
93
-
94
-
95
-
96
-
97
-
98
-
99
-
100
-
101
-
102
-
103
-
104
-
105
-
106
-
107
-
108
-
109
-
110
-
111
-
112
-
113
-
114
-
115
-
116
-
117
-
118
-
119
-
120
-
121
-
122
-
123
-
124
-
125
-
126
-
127
-
128
-
129
-
130
-
131
-
132
-
133
-
134
-
135
-
136
-
137
-
138
-
139
-
140
-
141
-
142
-
143
-
144
-
145
-
146
-
147
-
148
-
149
-
150
-
151
-
152
-
153
-
154
-
155
-
156
-
157
-
158
-
159
-
160
-
161
-
162
-
163
-
164
-
165
-
166
-
167
-
168
-
169
-
170
-
171
-
172
-
173
-
174
-
175
-
176
-
177
-
178
-
179
-
180
-
181
-
182
-
183
-
184
-
185
-
186
-
187
-
188
-
189
-
190
-
191
-
192
-
193
-
194
-
195
-
196
-
197
-
198
-
199
-
200
-
201
-
202
-
203
-
204
-
205
-
206
-
207
-
208
-
209
-
210
-
211
-
212
-
213
-
214
-
215
-
216
-
217
-
218
-
219
-
220
-
221
-
222
-
223
-
224
-
225
-
226
-
227
-
228
-
229
-
230
-
231
-
232
-
233
-
234
-
235
-
236
-
237
-
238
-
239
-
240
-
241
-
242
-
243
-
244
-
245
-
246
-
247
-
248
-
249
-
250
-
251
-
252
-
253
-
254
-
255
-
256
-
257
-
258
-
259
-
260
-
261
-
262
-
263
-
264
-
265
-
266
-
267
-
268
-
269
-
270
-
271
-
272
-
273
-
274
-
275
-
276
-
277
-
278
-
279
-
280
-
281
-
282
-
283
-
284
 |
 |

37
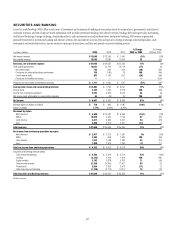
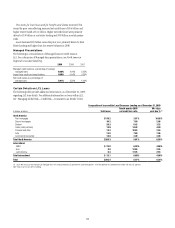
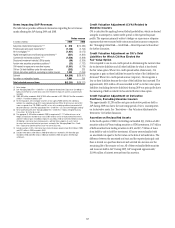
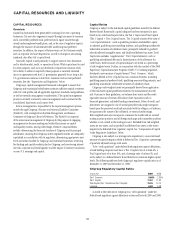
Items Impacting SAP Revenues
The table below provides additional information regarding the net revenue
marks affecting the SAP during 2009 and 2008.
Pretax revenue
In millions of dollars 2009 2008
Subprime-related direct exposures (1)(2) $ 810 $(14,283)
Private equity and equity investments (3) (1,148) (2,196)
Alt-A mortgages (1)(4) (1,451) (3,075)
Highly leveraged loans and financing commitments (5) (521) (4,892)
Commercial real estate positions (1)(6)(7) (1,526) (2,898)
Structured investment vehicles’ (SIVs) assets (80) (3,269)
Auction rate securities proprietary positions (8) (23) (1,732)
CVA related to exposure to monoline insurers (1,301) (5,736)
CVA on Citi debt liabilities under fair value option (252) 233
CVA on derivatives positions, excluding monoline insurers 1,283 (1,059)
Subtotal $(4,209) $(38,907)
Accretion on reclassified assets 1,994 190
Total selected revenue items $(2,215) $(38,717)
(1) Net of hedges.
(2) See “Managing Global Risk—Credit Risk—U.S. Subprime-Related Direct Exposure in Citi Holdings—
Special Asset Pool” for a further discussion of the related risk exposures and the associated marks
recorded.
(3) 2009: $95 million recorded in BAM; $1,053 million recorded in SAP. 2008: $418 million recorded in
BAM; $1,778 million recorded in SAP.
(4) For these purposes, Alt-A mortgage securities are non-agency RMBS where (i) the underlying
collateral has weighted average FICO scores between 680 and 720 or (ii) for instances where FICO
scores are greater than 720, RMBS have 30% or less of the underlying collateral composed of full
documentation loans. See “Managing Global Risk—Credit Risk—U.S. Consumer Mortgage Lending.”
(5) Net of underwriting fees. See “Managing Global Risk—Credit Risk—Highly Leveraged Financing
Transactions” for further discussion.
(6) The aggregate $1,526 million recorded in 2009 is comprised of $1,121 million of losses, net of
hedges, on exposures recorded at fair value, $562 million of losses on equity method investments,
and $157 million of gains recorded on exposures classified as held-for-investment/held-to-maturity.
Citi Holdings’ commercial real estate exposure is split into three categories of assets: held at
fair value; held-to-maturity/held-for-investment; and equity. See “Managing Global Risk—Credit
Risk—Exposure to Commercial Real Estate” for further discussion.
(7) Excludes positions in SIVs. Commercial real estate write-downs above include $182 million in 2009
and $191 million in 2008 recorded in BAM.
(8) Excludes write-downs of $6 million in 2009 ($16 million loss recorded in SAP; $8 million gain
recorded in BAM) and $393 million in 2008 (all recorded in BAM) arising from the ARS legal
settlements.
Credit Valuation Adjustment (CVA) Related to
Monoline Insurers
CVA is calculated by applying forward default probabilities, which are derived
using the counterparty’s current credit spread, to the expected exposure
profile. The exposure primarily relates to hedges on super-senior subprime
exposures that were executed with various monoline insurance companies.
See “Managing Global Risk—Credit Risk—Direct Exposure to Monolines”
for further discussion.
Credit Valuation Adjustment on Citi’s Debt
Liabilities for Which Citi Has Elected the
Fair Value Option
Citi is required to use its own credit spreads in determining the current value
for its derivative liabilities and all other liabilities for which it has elected
the fair value option. When Citi’s credit spreads widen (deteriorate), Citi
recognizes a gain on these liabilities because the value of the liabilities has
decreased. When Citi’s credit spreads narrow (improve), Citi recognizes a
loss on these liabilities because the value of the liabilities has increased. The
approximately $252 million of losses recorded in SAP on its fair value option
liabilities (excluding derivative liabilities) during 2009 was principally due to
the maturing of debt on which Citi has elected the fair value option.
Credit Valuation Adjustment on Derivative
Positions, Excluding Monoline Insurers
The approximately $1,283 million net gain in derivative positions held in
SAP during 2009 was due to the narrowing spreads of Citi’s counterparties
on its derivative assets. See “Derivatives—Fair Valuation Adjustments for
Derivatives” for further discussion.
Accretion on Reclassified Assets
In the fourth quarter of 2008, Citi Holdings reclassified $33.3 billion of debt
securities within SAP from trading securities to HTM investments, $4.7 billion
of debt securities from trading securities to AFS, and $15.7 billion of loans
from held-for-sale to held-for-investment. All assets were reclassified with
an amortized cost equal to the fair value on the date of reclassification. The
difference between the amortized cost basis and the expected principal cash
flows is treated as a purchase discount and accreted into income over the
remaining life of the security or loan. All of these reclassified debt securities
and loans are held in SAP. During 2009, SAP recognized approximately
$1,994 million of interest revenue from this accretion.