Citibank 2009 Annual Report Download - page 164
Download and view the complete annual report
Please find page 164 of the 2009 Citibank annual report below. You can navigate through the pages in the report by either clicking on the pages listed below, or by using the keyword search tool below to find specific information within the annual report.-
 1
1 -
2
-
3
-
4
-
5
-
6
-
7
-
8
-
9
-
10
-
11
-
12
-
13
-
14
-
15
-
16
-
17
-
18
-
19
-
20
-
21
-
22
-
23
-
24
-
25
-
26
-
27
-
28
-
29
-
30
-
31
-
32
-
33
-
34
-
35
-
36
-
37
-
38
-
39
-
40
-
41
-
42
-
43
-
44
-
45
-
46
-
47
-
48
-
49
-
50
-
51
-
52
-
53
-
54
-
55
-
56
-
57
-
58
-
59
-
60
-
61
-
62
-
63
-
64
-
65
-
66
-
67
-
68
-
69
-
70
-
71
-
72
-
73
-
74
-
75
-
76
-
77
-
78
-
79
-
80
-
81
-
82
-
83
-
84
-
85
-
86
-
87
-
88
-
89
-
90
-
91
-
92
-
93
-
94
-
95
-
96
-
97
-
98
-
99
-
100
-
101
-
102
-
103
-
104
-
105
-
106
-
107
-
108
-
109
-
110
-
111
-
112
-
113
-
114
-
115
-
116
-
117
-
118
-
119
-
120
-
121
-
122
-
123
-
124
-
125
-
126
-
127
-
128
-
129
-
130
-
131
-
132
-
133
-
134
-
135
-
136
-
137
-
138
-
139
-
140
-
141
-
142
-
143
-
144
-
145
-
146
-
147
-
148
-
149
-
150
-
151
-
152
-
153
-
 154
154 -
 155
155 -
 156
156 -
 157
157 -
 158
158 -
 159
159 -
 160
160 -
 161
161 -
 162
162 -
 163
163 -
 164
164 -
 165
165 -
 166
166 -
 167
167 -
 168
168 -
 169
169 -
 170
170 -
 171
171 -
 172
172 -
 173
173 -
 174
174 -
175
-
176
-
177
-
178
-
179
-
180
-
181
-
182
-
183
-
184
-
185
-
186
-
187
-
188
-
189
-
190
-
191
-
192
-
193
-
194
-
195
-
196
-
197
-
198
-
199
-
200
-
201
-
202
-
203
-
204
-
205
-
206
-
207
-
208
-
209
-
210
-
211
-
212
-
213
-
214
-
215
-
216
-
217
-
218
-
219
-
220
-
221
-
222
-
223
-
224
-
225
-
226
-
227
-
228
-
229
-
230
-
231
-
232
-
233
-
234
-
235
-
236
-
237
-
238
-
239
-
240
-
241
-
242
-
243
-
244
-
245
-
246
-
247
-
248
-
249
-
250
-
251
-
252
-
253
-
254
-
255
-
256
-
257
-
258
-
259
-
260
-
261
-
262
-
263
-
264
-
265
-
266
-
267
-
268
-
269
-
270
-
271
-
272
-
273
-
274
-
275
-
276
-
277
-
278
-
279
-
280
-
281
-
282
-
283
-
284
 |
 |

154
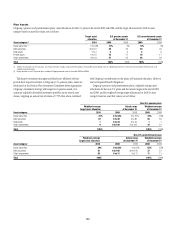
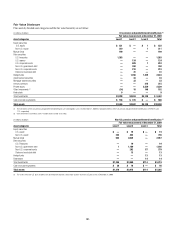
Information with respect to stock option activity under Citigroup stock option programs for the years ended December 31, 2009, 2008 and 2007 is as follows:
2009 2008 2007
Options
Weighted-
average
exercise
price
Intrinsic
value
per share Options
Weighted-
average
exercise
price
Intrinsic
value
per share Options
Weighted-
average
exercise
price
Intrinsic
value
per share
Outstanding, beginning of period 143,860,657 $41.84 $— 172,767,122 $43.08 $— 212,067,917 $41.87 $13.83
Granted—original 321,244,728 4.27 — 18,140,448 24.70 — 2,178,136 54.21 —
Granted—reload — — — 15,984 28.05 — 3,093,370 52.66 —
Forfeited or exchanged (39,285,305) 36.98 — (24,080,659) 42.19 — (8,796,402) 46.26 1.52
Expired (21,775,274) 36.21 — (20,441,584) 38.88 — (843,256) 43.40 4.38
Exercised — — — (2,540,654) 22.36 — (34,932,643) 36.62 11.16
Outstanding, end of period 404,044,806 $12.75 $— 143,860,657 $41.84 $— 172,767,122 $43.08 $ —
Exercisable at end of period 78,939,093 123,654,795 165,024,814
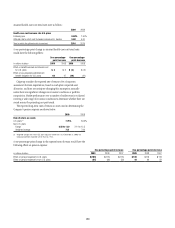
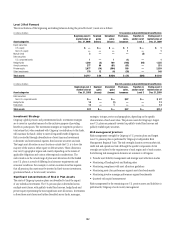
The following table summarizes the information about stock options outstanding under Citigroup stock option programs at December 31, 2009:
Options outstanding Options exercisable
Range of exercise prices
Number
outstanding
Weighted-average
contractual life
remaining
Weighted-average
exercise price
Number
exercisable
Weighted-average
exercise price
$2.97–$9.99 310,267,922 5.8 years $ 4.08 232,964 $ 5.89
$10.00–$19.99 5,718,033 8.6 years 14.75 257,547 15.74
$20.00–$29.99 10,765,908 4.5 years 24.52 3,518,919 24.81
$30.00–$39.99 6,340,854 3.8 years 34.66 4,836,471 35.01
$40.00–$49.99 63,222,120 1.0 years 46.17 62,878,916 46.16
$50.00–$56.41 7,729,969 2.0 years 52.12 7,214,276 51.96
404,044,806 5.0 years $12.76 78,939,093 $44.83
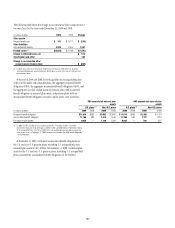
As of December 31, 2009, there was $445.6 million of total unrecognized
compensation cost related to stock options; this cost is expected to be
recognized over a weighted-average period of 1.9 years.
Fair Value Assumptions
Reload options are treated as separate grants from the related original grants.
Pursuant to the terms of currently outstanding reloadable options, upon
exercise of an option, if employees use previously owned shares to pay the
exercise price and surrender shares otherwise to be received for related tax
withholding, they will receive a reload option covering the same number
of shares used for such purposes, but only if the market price on the date of
exercise is at least 20% greater than the option exercise price. Reload options
vest after six months and carry the same expiration date as the option that
gave rise to the reload grant. The exercise price of a reload grant is the fair-
market value of Citigroup common stock on the date the underlying option
is exercised. Reload options are intended to encourage employees to exercise
options at an earlier date and to retain the shares acquired. The result of this
program is that employees generally will exercise options as soon as they
are able and, therefore, these options have shorter expected lives. Shorter
option lives result in lower valuations. However, such values are expensed
more quickly due to the shorter vesting period of reload options. In addition,
since reload options are treated as separate grants, the existence of the reload
feature results in a greater number of options being valued. Shares received
through option exercises under the reload program, as well as certain other
options, are subject to restrictions on sale.
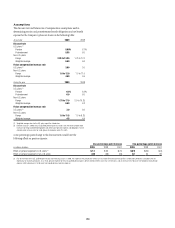
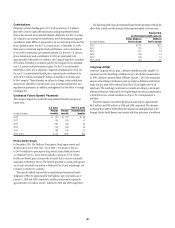
Additional valuation and related assumption information for Citigroup
option programs is presented below. Citigroup uses a lattice-type model to
value stock options.
For options granted during 2009 2008 2007
Weighted-average per-share fair value,
at December 31 $ 1.38 $ 3.62 $ 6.52
Weighted-average expected life
Original grants 5.87 yrs. 5.00 yrs. 4.66 yrs.
Reload grants N/A 1.04 yrs. 1.86 yrs.
Valuation assumptions
Expected volatility 35.89% 25.11% 19.21%
Risk-free interest rate 2.79% 2.76% 4.79%
Expected dividend yield 0.02% 4.53% 4.03%
Expected annual forfeitures
Original and reload grants 7.6% 7% 7%
N/A Not applicable