Citibank 2009 Annual Report Download - page 62
Download and view the complete annual report
Please find page 62 of the 2009 Citibank annual report below. You can navigate through the pages in the report by either clicking on the pages listed below, or by using the keyword search tool below to find specific information within the annual report.-
 1
1 -
2
-
3
-
4
-
5
-
6
-
7
-
8
-
9
-
10
-
11
-
12
-
13
-
14
-
15
-
16
-
17
-
18
-
19
-
20
-
21
-
22
-
23
-
24
-
25
-
26
-
27
-
28
-
29
-
30
-
31
-
32
-
33
-
34
-
35
-
36
-
37
-
38
-
39
-
40
-
41
-
42
-
43
-
44
-
45
-
46
-
47
-
48
-
49
-
50
-
51
-
 52
52 -
 53
53 -
 54
54 -
 55
55 -
 56
56 -
 57
57 -
 58
58 -
 59
59 -
 60
60 -
 61
61 -
 62
62 -
 63
63 -
 64
64 -
 65
65 -
 66
66 -
 67
67 -
 68
68 -
 69
69 -
 70
70 -
 71
71 -
 72
72 -
73
-
74
-
75
-
76
-
77
-
78
-
79
-
80
-
81
-
82
-
83
-
84
-
85
-
86
-
87
-
88
-
89
-
90
-
91
-
92
-
93
-
94
-
95
-
96
-
97
-
98
-
99
-
100
-
101
-
102
-
103
-
104
-
105
-
106
-
107
-
108
-
109
-
110
-
111
-
112
-
113
-
114
-
115
-
116
-
117
-
118
-
119
-
120
-
121
-
122
-
123
-
124
-
125
-
126
-
127
-
128
-
129
-
130
-
131
-
132
-
133
-
134
-
135
-
136
-
137
-
138
-
139
-
140
-
141
-
142
-
143
-
144
-
145
-
146
-
147
-
148
-
149
-
150
-
151
-
152
-
153
-
154
-
155
-
156
-
157
-
158
-
159
-
160
-
161
-
162
-
163
-
164
-
165
-
166
-
167
-
168
-
169
-
170
-
171
-
172
-
173
-
174
-
175
-
176
-
177
-
178
-
179
-
180
-
181
-
182
-
183
-
184
-
185
-
186
-
187
-
188
-
189
-
190
-
191
-
192
-
193
-
194
-
195
-
196
-
197
-
198
-
199
-
200
-
201
-
202
-
203
-
204
-
205
-
206
-
207
-
208
-
209
-
210
-
211
-
212
-
213
-
214
-
215
-
216
-
217
-
218
-
219
-
220
-
221
-
222
-
223
-
224
-
225
-
226
-
227
-
228
-
229
-
230
-
231
-
232
-
233
-
234
-
235
-
236
-
237
-
238
-
239
-
240
-
241
-
242
-
243
-
244
-
245
-
246
-
247
-
248
-
249
-
250
-
251
-
252
-
253
-
254
-
255
-
256
-
257
-
258
-
259
-
260
-
261
-
262
-
263
-
264
-
265
-
266
-
267
-
268
-
269
-
270
-
271
-
272
-
273
-
274
-
275
-
276
-
277
-
278
-
279
-
280
-
281
-
282
-
283
-
284
 |
 |

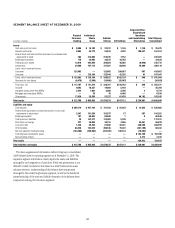
52
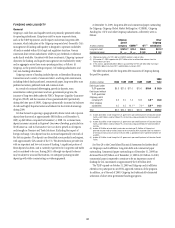
OFF-BALANCE-SHEET ARRANGEMENTS
Citigroup and its subsidiaries are involved with several types of off-balance-
sheet arrangements, including special purpose entities (SPEs), primarily in
connection with securitization activities in Regional Consumer Banking
and Institutional Clients Group. Citigroup and its subsidiaries use SPEs
principally to obtain liquidity and favorable capital treatment by securitizing
certain of Citigroup’s financial assets, assisting clients in securitizing their
financial assets and creating investment products for clients. For further
information on Citi’s securitization activities and involvement in SPEs,
see Note 23 to the Consolidated Financial Statements and “Significant
Accounting Policies and Significant Estimates—Securitizations.”
The following tables describe certain characteristics of assets owned by
certain identified significant unconsolidated variable interest entities (VIEs)
as of December 31, 2009. These VIEs and Citi’s exposure to the VIEs are
described in Note 23 to the Consolidated Financial Statements.
Credit rating distribution
Total
assets
(In billions of dollars)
Weighted
average
life AAA AA A BBB/BBB+
Citi-administered asset-backed commercial paper conduits $36.3 4.7 years 37% 13% 42% 8%
Asset class
% of total
portfolio
Student loans 33%
Trade receivables 5%
Credit cards and consumer loans 4%
Portfolio finance 10%
Commercial loans and corporate credit 18%
Export finance 22%
Auto 4%
Residential mortgage 4%
Total 100%
Credit rating distribution
Collateralized debt and loan obligations
Total
assets
(In billions of dollars)
Weighted
average
life A or higher BBB BB/B CCC Unrated
Collateralized debt obligations (CDOs) $19.3 3.9 years 12% 11% 16% 48% 13%
Collateralized loan obligations (CLOs) $18.8 6.8 years 8% 5% 37% 11% 39%
Credit rating distribution
Municipal securities tender option bond (TOB) trusts
Total
assets
(In billions of dollars)
Weighted
average
life AAA/Aaa
AA/Aa1 –
AA-/Aa3
Less
than
AA-/Aa3
Customer TOB trusts (not consolidated) $ 8.5 12.2 years 12% 85% 3%
Proprietary TOB trusts (consolidated and not consolidated) $12.3 16.4 years 7% 75% 18%
QSPE TOB trusts (not consolidated) $ 0.7 10.7 years 89% 11% 0%
See “Significant Accounting Policies and Significant Estimates—Securitizations” and Note 1 to the Consolidated Financial Statements for a discussion of
SFAS Nos. 166 and 167, effective in the first quarter of 2010, and their impact on Citi.