Citibank 2009 Annual Report Download - page 234
Download and view the complete annual report
Please find page 234 of the 2009 Citibank annual report below. You can navigate through the pages in the report by either clicking on the pages listed below, or by using the keyword search tool below to find specific information within the annual report.-
 1
1 -
2
-
3
-
4
-
5
-
6
-
7
-
8
-
9
-
10
-
11
-
12
-
13
-
14
-
15
-
16
-
17
-
18
-
19
-
20
-
21
-
22
-
23
-
24
-
25
-
26
-
27
-
28
-
29
-
30
-
31
-
32
-
33
-
34
-
35
-
36
-
37
-
38
-
39
-
40
-
41
-
42
-
43
-
44
-
45
-
46
-
47
-
48
-
49
-
50
-
51
-
52
-
53
-
54
-
55
-
56
-
57
-
58
-
59
-
60
-
61
-
62
-
63
-
64
-
65
-
66
-
67
-
68
-
69
-
70
-
71
-
72
-
73
-
74
-
75
-
76
-
77
-
78
-
79
-
80
-
81
-
82
-
83
-
84
-
85
-
86
-
87
-
88
-
89
-
90
-
91
-
92
-
93
-
94
-
95
-
96
-
97
-
98
-
99
-
100
-
101
-
102
-
103
-
104
-
105
-
106
-
107
-
108
-
109
-
110
-
111
-
112
-
113
-
114
-
115
-
116
-
117
-
118
-
119
-
120
-
121
-
122
-
123
-
124
-
125
-
126
-
127
-
128
-
129
-
130
-
131
-
132
-
133
-
134
-
135
-
136
-
137
-
138
-
139
-
140
-
141
-
142
-
143
-
144
-
145
-
146
-
147
-
148
-
149
-
150
-
151
-
152
-
153
-
154
-
155
-
156
-
157
-
158
-
159
-
160
-
161
-
162
-
163
-
164
-
165
-
166
-
167
-
168
-
169
-
170
-
171
-
172
-
173
-
174
-
175
-
176
-
177
-
178
-
179
-
180
-
181
-
182
-
183
-
184
-
185
-
186
-
187
-
188
-
189
-
190
-
191
-
192
-
193
-
194
-
195
-
196
-
197
-
198
-
199
-
200
-
201
-
202
-
203
-
204
-
205
-
206
-
207
-
208
-
209
-
210
-
211
-
212
-
213
-
214
-
215
-
216
-
217
-
218
-
219
-
220
-
221
-
222
-
223
-
 224
224 -
 225
225 -
 226
226 -
 227
227 -
 228
228 -
 229
229 -
 230
230 -
 231
231 -
 232
232 -
 233
233 -
 234
234 -
 235
235 -
 236
236 -
 237
237 -
 238
238 -
 239
239 -
 240
240 -
 241
241 -
 242
242 -
 243
243 -
 244
244 -
245
-
246
-
247
-
248
-
249
-
250
-
251
-
252
-
253
-
254
-
255
-
256
-
257
-
258
-
259
-
260
-
261
-
262
-
263
-
264
-
265
-
266
-
267
-
268
-
269
-
270
-
271
-
272
-
273
-
274
-
275
-
276
-
277
-
278
-
279
-
280
-
281
-
282
-
283
-
284
 |
 |
224
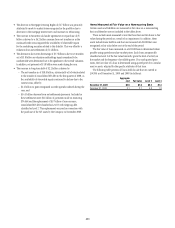
Determination of Fair Value
For assets and liabilities carried at fair value, the Company measures such
value using the procedures set out below, irrespective of whether these assets
and liabilities are carried at fair value as a result of an election or whether
they were previously carried at fair value.
When available, the Company generally uses quoted market prices to
determine fair value and classifies such items as Level 1. In some cases
where a market price is available, the Company will make use of acceptable
practical expedients (such as matrix pricing) to calculate fair value, in which
case the items are classified as Level 2.
If quoted market prices are not available, fair value is based upon
internally developed valuation techniques that use, where possible, current
market-based or independently sourced market parameters, such as interest
rates, currency rates, option volatilities, etc. Items valued using such
internally generated valuation techniques are classified according to the
lowest level input or value driver that is significant to the valuation. Thus, an
item may be classified in Level 3 even though there may be some significant
inputs that are readily observable.
Where available, the Company may also make use of quoted prices for
recent trading activity in positions with the same or similar characteristics
to that being valued. The frequency and size of transactions and the amount
of the bid-ask spread are among the factors considered in determining the
liquidity of markets and the relevance of observed prices from those markets.
If relevant and observable prices are available, those valuations would be
classified as Level 2. If prices are not available, other valuation techniques
would be used and the item would be classified as Level 3.
Fair value estimates from internal valuation techniques are verified,
where possible, to prices obtained from independent vendors or brokers.
Vendors and brokers’ valuations may be based on a variety of inputs ranging
from observed prices to proprietary valuation models.
The following section describes the valuation methodologies used by
the Company to measure various financial instruments at fair value,
including an indication of the level in the fair value hierarchy in which each
instrument is generally classified. Where appropriate, the description includes
details of the valuation models, the key inputs to those models as well as any
significant assumptions.
Securities purchased under agreements to resell and
securities sold under agreements to repurchase
No quoted prices exist for such instruments and so fair value is determined
using a discounted cash-flow technique. Cash flows are estimated based
on the terms of the contract, taking into account any embedded derivative
or other features. Expected cash flows are discounted using market rates
appropriate to the maturity of the instrument as well as the nature and
amount of collateral taken or received. Generally, such instruments are
classified within Level 2 of the fair value hierarchy as the inputs used in the
fair valuation are readily observable.
Trading account assets and liabilities—trading securities
and trading loans
When available, the Company uses quoted market prices to determine the
fair value of trading securities; such items are classified as Level 1 of the
fair value hierarchy. Examples include some government securities and
exchange-traded equity securities.
For bonds and secondary market loans traded over the counter, the
Company generally determines fair value utilizing internal valuation
techniques. Fair value estimates from internal valuation techniques are
verified, where possible, to prices obtained from independent vendors.
Vendors compile prices from various sources and may apply matrix pricing
for similar bonds or loans where no price is observable. If available, the
Company may also use quoted prices for recent trading activity of assets with
similar characteristics to the bond or loan being valued. Trading securities
and loans priced using such methods are generally classified as Level 2.
However, when less liquidity exists for a security or loan, a quoted price is
stale or prices from independent sources vary, a loan or security is generally
classified as Level 3.
Where the Company’s principal market for a portfolio of loans is the
securitization market, the Company uses the securitization price to determine
the fair value of the portfolio. The securitization price is determined from
the assumed proceeds of a hypothetical securitization in the current market,
adjusted for transformation costs (i.e., direct costs other than transaction
costs) and securitization uncertainties such as market conditions and
liquidity. As a result of the severe reduction in the level of activity in
certain securitization markets since the second half of 2007, observable
securitization prices for certain directly comparable portfolios of loans have
not been readily available. Therefore, such portfolios of loans are generally
classified as Level 3 of the fair value hierarchy. However, for other loan
securitization markets, such as those related to conforming prime fixed-rate
and conforming adjustable-rate mortgage loans, pricing verification of the
hypothetical securitizations has been possible, since these markets have
remained active. Accordingly, these loan portfolios are classified as Level 2 in
the fair value hierarchy.