Citibank 2009 Annual Report Download - page 37
Download and view the complete annual report
Please find page 37 of the 2009 Citibank annual report below. You can navigate through the pages in the report by either clicking on the pages listed below, or by using the keyword search tool below to find specific information within the annual report.-
 1
1 -
2
-
3
-
4
-
5
-
6
-
7
-
8
-
9
-
10
-
11
-
12
-
13
-
14
-
15
-
16
-
17
-
18
-
19
-
20
-
21
-
22
-
23
-
24
-
25
-
26
-
 27
27 -
 28
28 -
 29
29 -
 30
30 -
 31
31 -
 32
32 -
 33
33 -
 34
34 -
 35
35 -
 36
36 -
 37
37 -
 38
38 -
 39
39 -
 40
40 -
 41
41 -
 42
42 -
 43
43 -
 44
44 -
 45
45 -
 46
46 -
 47
47 -
48
-
49
-
50
-
51
-
52
-
53
-
54
-
55
-
56
-
57
-
58
-
59
-
60
-
61
-
62
-
63
-
64
-
65
-
66
-
67
-
68
-
69
-
70
-
71
-
72
-
73
-
74
-
75
-
76
-
77
-
78
-
79
-
80
-
81
-
82
-
83
-
84
-
85
-
86
-
87
-
88
-
89
-
90
-
91
-
92
-
93
-
94
-
95
-
96
-
97
-
98
-
99
-
100
-
101
-
102
-
103
-
104
-
105
-
106
-
107
-
108
-
109
-
110
-
111
-
112
-
113
-
114
-
115
-
116
-
117
-
118
-
119
-
120
-
121
-
122
-
123
-
124
-
125
-
126
-
127
-
128
-
129
-
130
-
131
-
132
-
133
-
134
-
135
-
136
-
137
-
138
-
139
-
140
-
141
-
142
-
143
-
144
-
145
-
146
-
147
-
148
-
149
-
150
-
151
-
152
-
153
-
154
-
155
-
156
-
157
-
158
-
159
-
160
-
161
-
162
-
163
-
164
-
165
-
166
-
167
-
168
-
169
-
170
-
171
-
172
-
173
-
174
-
175
-
176
-
177
-
178
-
179
-
180
-
181
-
182
-
183
-
184
-
185
-
186
-
187
-
188
-
189
-
190
-
191
-
192
-
193
-
194
-
195
-
196
-
197
-
198
-
199
-
200
-
201
-
202
-
203
-
204
-
205
-
206
-
207
-
208
-
209
-
210
-
211
-
212
-
213
-
214
-
215
-
216
-
217
-
218
-
219
-
220
-
221
-
222
-
223
-
224
-
225
-
226
-
227
-
228
-
229
-
230
-
231
-
232
-
233
-
234
-
235
-
236
-
237
-
238
-
239
-
240
-
241
-
242
-
243
-
244
-
245
-
246
-
247
-
248
-
249
-
250
-
251
-
252
-
253
-
254
-
255
-
256
-
257
-
258
-
259
-
260
-
261
-
262
-
263
-
264
-
265
-
266
-
267
-
268
-
269
-
270
-
271
-
272
-
273
-
274
-
275
-
276
-
277
-
278
-
279
-
280
-
281
-
282
-
283
-
284
 |
 |

27
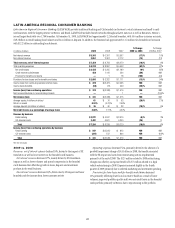
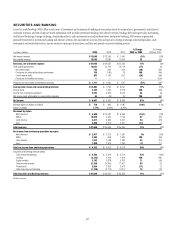
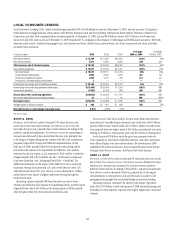
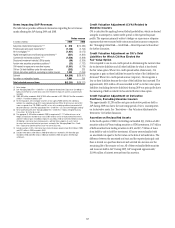
SECURITIES AND BANKING
Securities and Banking (S&B) offers a wide array of investment and commercial banking services and products for corporations, governments, institutional
and retail investors, and ultra-high-net worth individuals. S&B includes investment banking and advisory services, lending, debt and equity sales and trading,
institutional brokerage, foreign exchange, structured products, cash instruments and related derivatives, and private banking. S&B revenue is generated
primarily from fees for investment banking and advisory services, fees and interest on loans, fees and spread on foreign exchange, structured products, cash
instruments and related derivatives, income earned on principal transactions, and fees and spreads on private banking services.
In millions of dollars 2009 2008 2007
% Change
2009 vs. 2008
% Change
2008 vs. 2007
Net interest revenue $ 12,088 $ 12,255 $ 7,450 (1)% 64%
Non-interest revenue 15,558 12,680 17,906 23 (29)
Revenues, net of interest expense $ 27,646 $ 24,935 $ 25,356 11% (2)%
Total operating expenses 13,053 15,799 16,178 (17) (2)
Net credit losses 720 899 306 (20) NM
Provisions for unfunded lending commitments 138 (185) 79 NM NM
Credit reserve build 853 1,126 201 (24) NM
Provisions for benefits and claims —— 1 —(100)
Provisions for loan losses and benefits and claims $ 1,711 $ 1,840 $ 587 (7)% NM
Income before taxes and noncontrolling interests $ 12,882 $ 7,296 $ 8,591 77% (15)%
Income taxes 3,730 1,344 2,078 NM (35)
Income from continuing operations 9,152 5,952 6,513 54 (9)
Net income (loss) attributable to noncontrolling interests 55 (13) 25 NM NM
Net income $ 9,097 $ 5,965 $ 6,488 53% (8)%
Average assets (in billions of dollars) $ 779 $ 966 $ 1,085 (19)% (11)%
Return on assets 1.17% 0.62% 0.60%
Revenues by region
North America $ 9,400 $ 10,987 $ 8,998 (14)% 22%
EMEA 10,035 6,006 7,756 67 (23)
Latin America 3,411 2,369 3,161 44 (25)
Asia 4,800 5,573 5,441 (14) 2
Total revenues $ 27,646 $ 24,935 $ 25,356 11% (2)%
Net income from continuing operations by region
North America $ 2,417 $ 2,275 $ 1,687 6% 35%
EMEA 3,393 656 1,595 NM (59)
Latin America 1,512 1,048 1,436 44 (27)
Asia 1,830 1,973 1,795 (7) 10
Total net income from continuing operations $ 9,152 $ 5,952 $ 6,513 54% (9)%
Securities and Banking revenue details
Total investment banking $ 4,763 $ 3,245 $ 5,570 47% (42)%
Lending (2,153) 4,220 1,814 NM NM
Equity markets 3,182 2,878 5,202 11 (45)
Fixed income markets 21,540 14,395 11,507 50 25
Private bank 2,054 2,309 2,473 (11) (7)
Other Securities and Banking (1,740) (2,112) (1,210) 18 (75)
Total Securities and Banking revenues $ 27,646 $ 24,935 $ 25,356 11% (2)%
NM Not meaningful