Citibank 2009 Annual Report Download - page 170
Download and view the complete annual report
Please find page 170 of the 2009 Citibank annual report below. You can navigate through the pages in the report by either clicking on the pages listed below, or by using the keyword search tool below to find specific information within the annual report.-
 1
1 -
2
-
3
-
4
-
5
-
6
-
7
-
8
-
9
-
10
-
11
-
12
-
13
-
14
-
15
-
16
-
17
-
18
-
19
-
20
-
21
-
22
-
23
-
24
-
25
-
26
-
27
-
28
-
29
-
30
-
31
-
32
-
33
-
34
-
35
-
36
-
37
-
38
-
39
-
40
-
41
-
42
-
43
-
44
-
45
-
46
-
47
-
48
-
49
-
50
-
51
-
52
-
53
-
54
-
55
-
56
-
57
-
58
-
59
-
60
-
61
-
62
-
63
-
64
-
65
-
66
-
67
-
68
-
69
-
70
-
71
-
72
-
73
-
74
-
75
-
76
-
77
-
78
-
79
-
80
-
81
-
82
-
83
-
84
-
85
-
86
-
87
-
88
-
89
-
90
-
91
-
92
-
93
-
94
-
95
-
96
-
97
-
98
-
99
-
100
-
101
-
102
-
103
-
104
-
105
-
106
-
107
-
108
-
109
-
110
-
111
-
112
-
113
-
114
-
115
-
116
-
117
-
118
-
119
-
120
-
121
-
122
-
123
-
124
-
125
-
126
-
127
-
128
-
129
-
130
-
131
-
132
-
133
-
134
-
135
-
136
-
137
-
138
-
139
-
140
-
141
-
142
-
143
-
144
-
145
-
146
-
147
-
148
-
149
-
150
-
151
-
152
-
153
-
154
-
155
-
156
-
157
-
158
-
159
-
 160
160 -
 161
161 -
 162
162 -
 163
163 -
 164
164 -
 165
165 -
 166
166 -
 167
167 -
 168
168 -
 169
169 -
 170
170 -
 171
171 -
 172
172 -
 173
173 -
 174
174 -
 175
175 -
 176
176 -
 177
177 -
 178
178 -
 179
179 -
 180
180 -
181
-
182
-
183
-
184
-
185
-
186
-
187
-
188
-
189
-
190
-
191
-
192
-
193
-
194
-
195
-
196
-
197
-
198
-
199
-
200
-
201
-
202
-
203
-
204
-
205
-
206
-
207
-
208
-
209
-
210
-
211
-
212
-
213
-
214
-
215
-
216
-
217
-
218
-
219
-
220
-
221
-
222
-
223
-
224
-
225
-
226
-
227
-
228
-
229
-
230
-
231
-
232
-
233
-
234
-
235
-
236
-
237
-
238
-
239
-
240
-
241
-
242
-
243
-
244
-
245
-
246
-
247
-
248
-
249
-
250
-
251
-
252
-
253
-
254
-
255
-
256
-
257
-
258
-
259
-
260
-
261
-
262
-
263
-
264
-
265
-
266
-
267
-
268
-
269
-
270
-
271
-
272
-
273
-
274
-
275
-
276
-
277
-
278
-
279
-
280
-
281
-
282
-
283
-
284
 |
 |

160
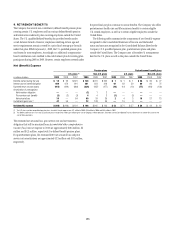
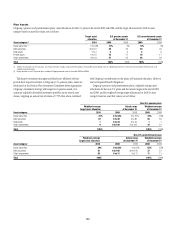
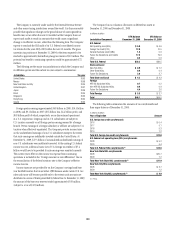
Plan Assets
Citigroup’s pension and postretirement plans’ asset allocations for the U.S. plans at the end of 2009 and 2008, and the target allocations for 2010 by asset
category based on asset fair values, are as follows:
Target asset
allocation
U.S. pension assets
at December 31
U.S. postretirement assets
at December 31
Asset category (1) 2010 2009 2008 2009 2008
Equity securities (2) 0 to 34% 12% 6 % 12% 6%
Debt securities 30 to 67 40 42 39 42
Real estate 0 to 7 565 6
Private equity 0 to 15 16 17 16 17
Other investments 8 to 34 27 29 28 29
Total 100% 100 % 100% 100%
(1) Target asset allocations for the U.S. plans are set by investment strategy, not by investment product. For example, private equities with an underlying investment in real estate are classified in the real estate asset
category, not private equity.
(2) Equity securities in the U.S. pension plans include no Citigroup common stock at the end of 2009 and 2008.
Third-party investment managers and third-party affiliated advisors
provide their respective services to Citigroup’s U.S. pension plans. Assets are
rebalanced as the Pension Plan Investment Committee deems appropriate.
Citigroup’s investment strategy, with respect to its pension assets, is to
maintain a globally diversified investment portfolio across several asset
classes, targeting an annual rate of return of 7.75% that, when combined
with Citigroup’s contributions to the plans, will maintain the plans’ ability to
meet all required benefit obligations.
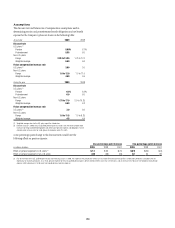
Citigroup’s pension and postretirement plans’ weighted-average asset
allocations for the non-U.S. plans and the actual ranges at the end of 2009
and 2008, and the weighted-average target allocations for 2010 by asset
category based on asset fair values, are as follows:
Non-U.S. pension plans
Weighted-average
target asset allocation
Actual range
at December 31
Weighted-average
at December 31
Asset category 2010 2009 2008 2009 2008
Equity securities 23% 0 to 64% 0 to 57% 34% 34%
Debt securities 67 0 to 99 0 to 86 55 55
Real estate 1 0 to 29 0 to 40 11
Other investments 9 0 to 100 0 to 100 10 10
Total 100% 100 % 100 %
Non-U.S. postretirement plans
Weighted-average
target asset allocation
Actual range
at December 31
Weighted-average
at December 31
Asset category 2010 2009 2008 2009 2008
Equity securities 39% 0 to 53% 0 to 53% 52% 52%
Debt securities 41 0 to 100 36 to 100 37 37
Other investments 20 0 to 11 0 to 11 11 11
Total 100% 100 % 100%