Citibank 2009 Annual Report Download - page 74
Download and view the complete annual report
Please find page 74 of the 2009 Citibank annual report below. You can navigate through the pages in the report by either clicking on the pages listed below, or by using the keyword search tool below to find specific information within the annual report.-
 1
1 -
2
-
3
-
4
-
5
-
6
-
7
-
8
-
9
-
10
-
11
-
12
-
13
-
14
-
15
-
16
-
17
-
18
-
19
-
20
-
21
-
22
-
23
-
24
-
25
-
26
-
27
-
28
-
29
-
30
-
31
-
32
-
33
-
34
-
35
-
36
-
37
-
38
-
39
-
40
-
41
-
42
-
43
-
44
-
45
-
46
-
47
-
48
-
49
-
50
-
51
-
52
-
53
-
54
-
55
-
56
-
57
-
58
-
59
-
60
-
61
-
62
-
63
-
 64
64 -
 65
65 -
 66
66 -
 67
67 -
 68
68 -
 69
69 -
 70
70 -
 71
71 -
 72
72 -
 73
73 -
 74
74 -
 75
75 -
 76
76 -
 77
77 -
 78
78 -
 79
79 -
 80
80 -
 81
81 -
 82
82 -
 83
83 -
 84
84 -
85
-
86
-
87
-
88
-
89
-
90
-
91
-
92
-
93
-
94
-
95
-
96
-
97
-
98
-
99
-
100
-
101
-
102
-
103
-
104
-
105
-
106
-
107
-
108
-
109
-
110
-
111
-
112
-
113
-
114
-
115
-
116
-
117
-
118
-
119
-
120
-
121
-
122
-
123
-
124
-
125
-
126
-
127
-
128
-
129
-
130
-
131
-
132
-
133
-
134
-
135
-
136
-
137
-
138
-
139
-
140
-
141
-
142
-
143
-
144
-
145
-
146
-
147
-
148
-
149
-
150
-
151
-
152
-
153
-
154
-
155
-
156
-
157
-
158
-
159
-
160
-
161
-
162
-
163
-
164
-
165
-
166
-
167
-
168
-
169
-
170
-
171
-
172
-
173
-
174
-
175
-
176
-
177
-
178
-
179
-
180
-
181
-
182
-
183
-
184
-
185
-
186
-
187
-
188
-
189
-
190
-
191
-
192
-
193
-
194
-
195
-
196
-
197
-
198
-
199
-
200
-
201
-
202
-
203
-
204
-
205
-
206
-
207
-
208
-
209
-
210
-
211
-
212
-
213
-
214
-
215
-
216
-
217
-
218
-
219
-
220
-
221
-
222
-
223
-
224
-
225
-
226
-
227
-
228
-
229
-
230
-
231
-
232
-
233
-
234
-
235
-
236
-
237
-
238
-
239
-
240
-
241
-
242
-
243
-
244
-
245
-
246
-
247
-
248
-
249
-
250
-
251
-
252
-
253
-
254
-
255
-
256
-
257
-
258
-
259
-
260
-
261
-
262
-
263
-
264
-
265
-
266
-
267
-
268
-
269
-
270
-
271
-
272
-
273
-
274
-
275
-
276
-
277
-
278
-
279
-
280
-
281
-
282
-
283
-
284
 |
 |

64
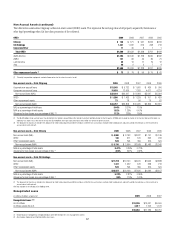
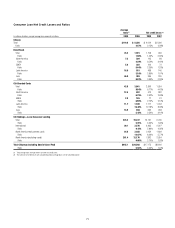
Loans Outstanding
In millions of dollars at year end 2009 2008 2007 2006 2005
Consumer loans
In U.S. offices
Mortgage and real estate (1) $183,842 $219,482 $240,644 $208,592 $180,725
Installment, revolving credit, and other 58,099 64,319 69,379 62,758 60,983
Cards 28,951 44,418 46,559 48,849 44,756
Commercial and industrial 5,640 7,041 7,716 7,595 6,816
Lease financing 11 31 3,151 4,743 5,095
$276,543 $335,291 $367,449 $332,537 $298,375
In offices outside the U.S.
Mortgage and real estate (1) $ 47,297 $ 44,382 $ 49,326 $ 41,859 $ 37,319
Installment, revolving credit, and other 42,805 41,272 70,205 61,509 51,710
Cards 41,493 42,586 46,176 30,745 25,856
Commercial and industrial 14,780 16,814 18,422 15,750 13,529
Lease financing 331 304 1,124 960 866
$146,706 $145,358 $185,253 $150,823 $129,280
Total consumer loans $423,249 $480,649 $552,702 $483,360 $427,655
Unearned income 808 738 787 460 4
Consumer loans, net of unearned income $424,057 $481,387 $553,489 $483,820 $427,659
Corporate loans
In U.S. offices
Commercial and industrial $ 15,614 $ 26,447 $ 20,696 $ 18,066 $ 17,870
Loans to financial institutions 6,947 10,200 8,778 4,126 1,235
Mortgage and real estate (1) 22,560 28,043 18,403 17,476 11,349
Installment, revolving credit, and other 17,737 22,050 26,539 17,051 17,853
Lease financing 1,297 1,476 1,630 2,101 1,952
$ 64,155 $ 88,216 $ 76,046 $ 58,820 $ 50,259
In offices outside the U.S.
Commercial and industrial $ 68,467 $ 79,809 $ 94,775 $ 89,115 $ 65,460
Installment, revolving credit, and other 9,683 17,441 21,037 14,146 13,120
Mortgage and real estate (1) 9,779 11,375 9,981 7,932 7,506
Loans to financial institutions 15,113 18,413 20,467 21,827 16,889
Lease financing 1,295 1,850 2,292 2,024 2,082
Governments and official institutions 1,229 385 442 1,857 882
$105,566 $129,273 $148,994 $136,901 $105,939
Total corporate loans $169,721 $217,489 $225,040 $195,721 $156,198
Unearned income (2,274) (4,660) (536) (349) (354)
Corporate loans, net of unearned income $167,447 $212,829 $224,504 $195,372 $155,844
Total loans—net of unearned income $591,504 $694,216 $777,993 $679,192 $583,503
Allowance for loan losses—on drawn exposures (36,033) (29,616) (16,117) (8,940) (9,782)
Total loans—net of unearned income and allowance for credit losses $555,471 $664,600 $761,876 $670,252 $573,721
Allowance for loan losses as a percentage of total loans—net of
unearned income 6.09% 4.27% 2.07% 1.32% 1.68%
Allowance for consumer loan losses as a percentage of total consumer
loans—net of unearned income 6.70% 4.61% 2.26%
Allowance for corporate loan losses as a percentage of total corporate
loans—net of unearned income 4.56% 3.48% 1.61%
(1) Loans secured primarily by real estate.