Citibank 2009 Annual Report Download - page 100
Download and view the complete annual report
Please find page 100 of the 2009 Citibank annual report below. You can navigate through the pages in the report by either clicking on the pages listed below, or by using the keyword search tool below to find specific information within the annual report.-
 1
1 -
2
-
3
-
4
-
5
-
6
-
7
-
8
-
9
-
10
-
11
-
12
-
13
-
14
-
15
-
16
-
17
-
18
-
19
-
20
-
21
-
22
-
23
-
24
-
25
-
26
-
27
-
28
-
29
-
30
-
31
-
32
-
33
-
34
-
35
-
36
-
37
-
38
-
39
-
40
-
41
-
42
-
43
-
44
-
45
-
46
-
47
-
48
-
49
-
50
-
51
-
52
-
53
-
54
-
55
-
56
-
57
-
58
-
59
-
60
-
61
-
62
-
63
-
64
-
65
-
66
-
67
-
68
-
69
-
70
-
71
-
72
-
73
-
74
-
75
-
76
-
77
-
78
-
79
-
80
-
81
-
82
-
83
-
84
-
85
-
86
-
87
-
88
-
89
-
 90
90 -
 91
91 -
 92
92 -
 93
93 -
 94
94 -
 95
95 -
 96
96 -
 97
97 -
 98
98 -
 99
99 -
 100
100 -
 101
101 -
 102
102 -
 103
103 -
 104
104 -
 105
105 -
 106
106 -
 107
107 -
 108
108 -
 109
109 -
 110
110 -
111
-
112
-
113
-
114
-
115
-
116
-
117
-
118
-
119
-
120
-
121
-
122
-
123
-
124
-
125
-
126
-
127
-
128
-
129
-
130
-
131
-
132
-
133
-
134
-
135
-
136
-
137
-
138
-
139
-
140
-
141
-
142
-
143
-
144
-
145
-
146
-
147
-
148
-
149
-
150
-
151
-
152
-
153
-
154
-
155
-
156
-
157
-
158
-
159
-
160
-
161
-
162
-
163
-
164
-
165
-
166
-
167
-
168
-
169
-
170
-
171
-
172
-
173
-
174
-
175
-
176
-
177
-
178
-
179
-
180
-
181
-
182
-
183
-
184
-
185
-
186
-
187
-
188
-
189
-
190
-
191
-
192
-
193
-
194
-
195
-
196
-
197
-
198
-
199
-
200
-
201
-
202
-
203
-
204
-
205
-
206
-
207
-
208
-
209
-
210
-
211
-
212
-
213
-
214
-
215
-
216
-
217
-
218
-
219
-
220
-
221
-
222
-
223
-
224
-
225
-
226
-
227
-
228
-
229
-
230
-
231
-
232
-
233
-
234
-
235
-
236
-
237
-
238
-
239
-
240
-
241
-
242
-
243
-
244
-
245
-
246
-
247
-
248
-
249
-
250
-
251
-
252
-
253
-
254
-
255
-
256
-
257
-
258
-
259
-
260
-
261
-
262
-
263
-
264
-
265
-
266
-
267
-
268
-
269
-
270
-
271
-
272
-
273
-
274
-
275
-
276
-
277
-
278
-
279
-
280
-
281
-
282
-
283
-
284
 |
 |

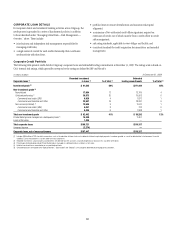
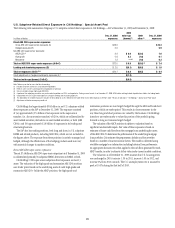
90
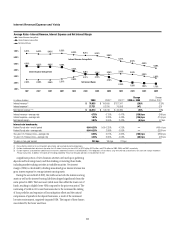
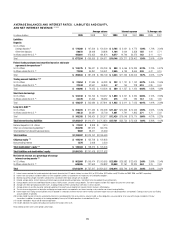
Non-Trading Portfolios
The exposures in the following table represent the approximate annualized
risk to NIR assuming an unanticipated parallel instantaneous 100 bps
change, as well as a more gradual 100 bps (25 bps per quarter) parallel
change in rates compared with the market forward interest rates in
selected currencies.
December 31, 2009 December 31, 2008
In millions of dollars Increase Decrease Increase Decrease
U.S. dollar
Instantaneous change
Gross IRE $(1,194) $1,473 $(801) $ 391
Less: ICG trading 336 (350) 563 (465)
Net non-trading IRE $ (859) $1,123 $(238) $ (74)
Gradual change
Gross IRE $ (565) $ 872 $(456) $ 81
Less: ICG trading 105 (164) 281 (308)
Net non-trading IRE $ (460) $ 708 $(175) $ (227)
Mexican peso
Instantaneous change $ 50 $ (50) $ (18) $ 18
Gradual change $ 26 $ (26) $ (14) $ 14
Euro
Instantaneous change $ (139) $ 87 $ (56) $ 57
Gradual change $ (89) $ 89 $ (43) $ 43
Japanese yen
Instantaneous change $ 213 NM $ 172 NM
Gradual change $ 124 NM $ 51 NM
Pound sterling
Instantaneous change $ (4) $ 15 $ (1) $ 1
Gradual change $ (1) $ 1 $ — $ —
NM Not meaningful. A 100 bps decrease in interest rates would imply negative rates for the Japanese yen
yield curve.
Certain trading-oriented businesses within Citi have accrual-accounted
positions that are hedged with mark-to-market positions. If the economic
impact of these offsetting positions is included, Citi’s 12-month exposure
to a 100 bps instantaneous rise in interest rates is reduced from $(1,194)
million to $(731) million. The changes in the U.S. dollar IRE from the
prior year reflect changes in the customer-related asset and liability mix, the
expected impact of market rates on customer behavior and Citigroup’s view
of prevailing interest rates.
The following table shows the risk to NIR from six different changes in the implied-forward rates. Each scenario assumes that the rate change will occur on a
gradual basis every three months over the course of one year.
Scenario 1 Scenario 2 Scenario 3 Scenario 4 Scenario 5 Scenario 6
Overnight rate change (bps) — 100 200 (200) (100) —
10-year rate change (bps) (100) — 100 (100) — 100
Impact to net interest revenue (in millions of dollars) $ 199 $(502) $(1,161) $ 560 $ 464 $ (42)