Citibank 2009 Annual Report Download - page 197
Download and view the complete annual report
Please find page 197 of the 2009 Citibank annual report below. You can navigate through the pages in the report by either clicking on the pages listed below, or by using the keyword search tool below to find specific information within the annual report.-
 1
1 -
2
-
3
-
4
-
5
-
6
-
7
-
8
-
9
-
10
-
11
-
12
-
13
-
14
-
15
-
16
-
17
-
18
-
19
-
20
-
21
-
22
-
23
-
24
-
25
-
26
-
27
-
28
-
29
-
30
-
31
-
32
-
33
-
34
-
35
-
36
-
37
-
38
-
39
-
40
-
41
-
42
-
43
-
44
-
45
-
46
-
47
-
48
-
49
-
50
-
51
-
52
-
53
-
54
-
55
-
56
-
57
-
58
-
59
-
60
-
61
-
62
-
63
-
64
-
65
-
66
-
67
-
68
-
69
-
70
-
71
-
72
-
73
-
74
-
75
-
76
-
77
-
78
-
79
-
80
-
81
-
82
-
83
-
84
-
85
-
86
-
87
-
88
-
89
-
90
-
91
-
92
-
93
-
94
-
95
-
96
-
97
-
98
-
99
-
100
-
101
-
102
-
103
-
104
-
105
-
106
-
107
-
108
-
109
-
110
-
111
-
112
-
113
-
114
-
115
-
116
-
117
-
118
-
119
-
120
-
121
-
122
-
123
-
124
-
125
-
126
-
127
-
128
-
129
-
130
-
131
-
132
-
133
-
134
-
135
-
136
-
137
-
138
-
139
-
140
-
141
-
142
-
143
-
144
-
145
-
146
-
147
-
148
-
149
-
150
-
151
-
152
-
153
-
154
-
155
-
156
-
157
-
158
-
159
-
160
-
161
-
162
-
163
-
164
-
165
-
166
-
167
-
168
-
169
-
170
-
171
-
172
-
173
-
174
-
175
-
176
-
177
-
178
-
179
-
180
-
181
-
182
-
183
-
184
-
185
-
186
-
 187
187 -
 188
188 -
 189
189 -
 190
190 -
 191
191 -
 192
192 -
 193
193 -
 194
194 -
 195
195 -
 196
196 -
 197
197 -
 198
198 -
 199
199 -
 200
200 -
 201
201 -
 202
202 -
 203
203 -
 204
204 -
 205
205 -
 206
206 -
 207
207 -
208
-
209
-
210
-
211
-
212
-
213
-
214
-
215
-
216
-
217
-
218
-
219
-
220
-
221
-
222
-
223
-
224
-
225
-
226
-
227
-
228
-
229
-
230
-
231
-
232
-
233
-
234
-
235
-
236
-
237
-
238
-
239
-
240
-
241
-
242
-
243
-
244
-
245
-
246
-
247
-
248
-
249
-
250
-
251
-
252
-
253
-
254
-
255
-
256
-
257
-
258
-
259
-
260
-
261
-
262
-
263
-
264
-
265
-
266
-
267
-
268
-
269
-
270
-
271
-
272
-
273
-
274
-
275
-
276
-
277
-
278
-
279
-
280
-
281
-
282
-
283
-
284
 |
 |

187
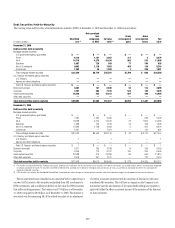
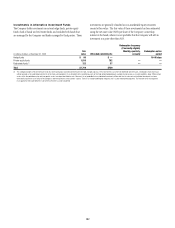
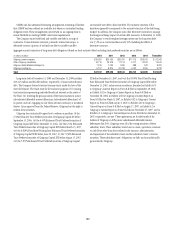
Based on the results of the second step of testing, at December 31, 2008,
the Company recorded a $9.6 billion pretax ($8.7 billion after-tax) goodwill
impairment charge in the fourth quarter of 2008, representing most of
the goodwill allocated to these reporting units. The primary cause for the
goodwill impairment at December 31, 2008 in the above reporting units
was rapid deterioration in the financial markets, as well as in the global
economic outlook particularly during the period beginning mid-November
through year-end 2008. The more significant fair value adjustments in the
pro forma purchase price allocation in the second step of testing were to
fair value loans and debt and were made to identify and value identifiable
intangibles. The adjustments to measure the assets, liabilities and intangibles
were for the purpose of measuring the implied fair value of goodwill and
such adjustments are not reflected in the Consolidated Balance Sheet.
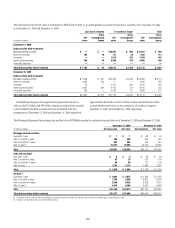
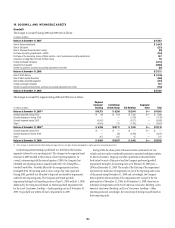
The following table shows reporting units with goodwill balances and
the excess of fair value as a percentage over allocated book value as of
December 31, 2009.
In millions of dollars
Reporting unit (1)
Fair value as a % of
allocated book value Goodwill
North America Regional Consumer Banking 174% $2,453
EMEA Regional Consumer Banking 163 255
Asia Regional Consumer Banking 303 5,533
Latin America Regional Consumer Banking 215 1,352
Securities and Banking 203 8,784
Transaction Services 2,079 1,573
Brokerage and Asset Management 161 759
Local Consumer Lending—Cards 112 4,683
(1) Local Consumer Lending—Other is excluded from the table as there is no goodwill allocated to it.
While no impairment was noted in step one of the Company’s Local
Consumer Lending—Cards reporting unit impairment test at November 30,
2009, goodwill present in that reporting unit may be particularly sensitive to
further deterioration in economic conditions. Under the market approach
for valuing this reporting unit, the earnings multiples and transaction
multiples were selected from multiples obtained using data from guideline
companies and acquisitions. The selection of the actual multiple considers
operating performance and financial condition such as return on equity and
net income growth of Local Consumer Lending—Cards as compared to the
guideline companies and acquisitions. For the valuation under the income
approach, the Company utilized a discount rate, which it believes reflects the
risk and uncertainty related to the projected cash flows, and selected 2012 as
the terminal year.
Small deterioration in the assumptions used in the valuations, in
particular the discount rate and growth rate assumptions used in the net
income projections, could significantly affect the Company’s impairment
evaluation and, hence, results. If the future were to differ adversely from
management’s best estimate of key economic assumptions and associated
cash flows were to decrease by a small margin, the Company could
potentially experience future material impairment charges with respect to
$4,683 million of goodwill remaining in our Local Consumer Lending—
Cards reporting unit. Any such charges, by themselves, would not negatively
affect the Company’s Tier 1, Tier 1 Common and Total Capital regulatory
ratios, its Tangible Common Equity or the Company’s liquidity position.