Citibank 2009 Annual Report Download - page 208
Download and view the complete annual report
Please find page 208 of the 2009 Citibank annual report below. You can navigate through the pages in the report by either clicking on the pages listed below, or by using the keyword search tool below to find specific information within the annual report.-
 1
1 -
2
-
3
-
4
-
5
-
6
-
7
-
8
-
9
-
10
-
11
-
12
-
13
-
14
-
15
-
16
-
17
-
18
-
19
-
20
-
21
-
22
-
23
-
24
-
25
-
26
-
27
-
28
-
29
-
30
-
31
-
32
-
33
-
34
-
35
-
36
-
37
-
38
-
39
-
40
-
41
-
42
-
43
-
44
-
45
-
46
-
47
-
48
-
49
-
50
-
51
-
52
-
53
-
54
-
55
-
56
-
57
-
58
-
59
-
60
-
61
-
62
-
63
-
64
-
65
-
66
-
67
-
68
-
69
-
70
-
71
-
72
-
73
-
74
-
75
-
76
-
77
-
78
-
79
-
80
-
81
-
82
-
83
-
84
-
85
-
86
-
87
-
88
-
89
-
90
-
91
-
92
-
93
-
94
-
95
-
96
-
97
-
98
-
99
-
100
-
101
-
102
-
103
-
104
-
105
-
106
-
107
-
108
-
109
-
110
-
111
-
112
-
113
-
114
-
115
-
116
-
117
-
118
-
119
-
120
-
121
-
122
-
123
-
124
-
125
-
126
-
127
-
128
-
129
-
130
-
131
-
132
-
133
-
134
-
135
-
136
-
137
-
138
-
139
-
140
-
141
-
142
-
143
-
144
-
145
-
146
-
147
-
148
-
149
-
150
-
151
-
152
-
153
-
154
-
155
-
156
-
157
-
158
-
159
-
160
-
161
-
162
-
163
-
164
-
165
-
166
-
167
-
168
-
169
-
170
-
171
-
172
-
173
-
174
-
175
-
176
-
177
-
178
-
179
-
180
-
181
-
182
-
183
-
184
-
185
-
186
-
187
-
188
-
189
-
190
-
191
-
192
-
193
-
194
-
195
-
196
-
197
-
 198
198 -
 199
199 -
 200
200 -
 201
201 -
 202
202 -
 203
203 -
 204
204 -
 205
205 -
 206
206 -
 207
207 -
 208
208 -
 209
209 -
 210
210 -
 211
211 -
 212
212 -
 213
213 -
 214
214 -
 215
215 -
 216
216 -
 217
217 -
 218
218 -
219
-
220
-
221
-
222
-
223
-
224
-
225
-
226
-
227
-
228
-
229
-
230
-
231
-
232
-
233
-
234
-
235
-
236
-
237
-
238
-
239
-
240
-
241
-
242
-
243
-
244
-
245
-
246
-
247
-
248
-
249
-
250
-
251
-
252
-
253
-
254
-
255
-
256
-
257
-
258
-
259
-
260
-
261
-
262
-
263
-
264
-
265
-
266
-
267
-
268
-
269
-
270
-
271
-
272
-
273
-
274
-
275
-
276
-
277
-
278
-
279
-
280
-
281
-
282
-
283
-
284
 |
 |

198
This table does not include:
certain venture capital investments made by some of the Company’s •
private equity subsidiaries, as the Company accounts for these investments
in accordance with the Investment Company Audit Guide;
certain limited partnerships where the Company is the general partner •
and the limited partners have the right to replace the general partner or
liquidate the funds;
certain investment funds for which the Company provides investment •
management services and personal estate trusts for which the Company
provides administrative, trustee and/or investment management services;
VIEs structured by third parties where the Company holds securities in •
inventory. These investments are made on arm’s-length terms; and
transferred assets to a VIE where the transfer did not qualify as a sale and •
where the Company did not have any other involvement that is deemed
to be a variable interest with the VIE. These transfers are accounted for as
secured borrowings by the Company.
The asset balances for consolidated VIEs represent the carrying amounts
of the assets consolidated by the Company. The carrying amount may
represent the amortized cost or the current fair value of the assets depending
on the legal form of the asset (e.g., security or loan) and the Company’s
standard accounting policies for the asset type and line of business.
The asset balances for unconsolidated VIEs where the Company has
significant involvement represent the most current information available
to the Company. In most cases, the asset balances represent an amortized
cost basis without regard to impairments in fair value, unless fair value
information is readily available to the Company. For VIEs that obtain
asset exposures synthetically through derivative instruments (for example,
synthetic CDOs), the table includes the full original notional amount of the
derivative as an asset.
The maximum funded exposure represents the balance sheet carrying
amount of the Company’s investment in the VIE. It reflects the initial
amount of cash invested in the VIE plus any accrued interest and is adjusted
for any impairments in value recognized in earnings and any cash principal
payments received. The maximum exposure of unfunded positions represents
the remaining undrawn committed amount, including liquidity and credit
facilities provided by the Company, or the notional amount of a derivative
instrument considered to be a variable interest, adjusted for any declines
in fair value recognized in earnings. In certain transactions, the Company
has entered into derivative instruments or other arrangements that are not
considered variable interests in the VIE (e.g., interest rate swaps, cross-
currency swaps, or where the Company is the purchaser of credit protection
under a credit default swap or total return swap where the Company pays
the total return on certain assets to the SPE). Receivables under such
arrangements are not included in the maximum exposure amounts.
Funding Commitments for Significant Unconsolidated VIEs—
Liquidity Facilities and Loan Commitments
The following table presents the notional amount of liquidity facilities and
loan commitments that are classified as funding commitments in the SPE
table as of December 31, 2009:
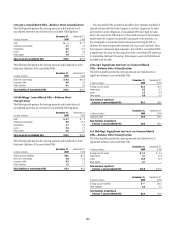
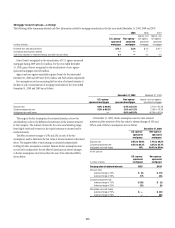
In millions of dollars Liquidity Facilities Loan Commitments
Citicorp
Citi-administered asset-backed commercial paper conduits (ABCP) $20,486 $ 1,718
Third-party commercial paper conduits 353 —
Asset-based financing — 549
Municipal securities tender option bond trusts (TOBs) 6,304 —
Municipal investments — 18
Other 10 23
Total Citicorp $27,153 $ 2,308
Citi Holdings
Citi-administered asset-backed commercial paper conduits (ABCP) $11,978 $ 1,682
Third-party commercial paper conduits 252 —
Collateralized loan obligations (CLOs) — 19
Asset-based financing — 1,311
Municipal investments — 386
Investment Funds — 93
Other — 257
Total Citi Holdings $12,230 $ 3,748
Total Citigroup funding commitments $39,383 $6,056