Citibank 2009 Annual Report Download - page 34
Download and view the complete annual report
Please find page 34 of the 2009 Citibank annual report below. You can navigate through the pages in the report by either clicking on the pages listed below, or by using the keyword search tool below to find specific information within the annual report.-
 1
1 -
2
-
3
-
4
-
5
-
6
-
7
-
8
-
9
-
10
-
11
-
12
-
13
-
14
-
15
-
16
-
17
-
18
-
19
-
20
-
21
-
22
-
23
-
 24
24 -
 25
25 -
 26
26 -
 27
27 -
 28
28 -
 29
29 -
 30
30 -
 31
31 -
 32
32 -
 33
33 -
 34
34 -
 35
35 -
 36
36 -
 37
37 -
 38
38 -
 39
39 -
 40
40 -
 41
41 -
 42
42 -
 43
43 -
 44
44 -
45
-
46
-
47
-
48
-
49
-
50
-
51
-
52
-
53
-
54
-
55
-
56
-
57
-
58
-
59
-
60
-
61
-
62
-
63
-
64
-
65
-
66
-
67
-
68
-
69
-
70
-
71
-
72
-
73
-
74
-
75
-
76
-
77
-
78
-
79
-
80
-
81
-
82
-
83
-
84
-
85
-
86
-
87
-
88
-
89
-
90
-
91
-
92
-
93
-
94
-
95
-
96
-
97
-
98
-
99
-
100
-
101
-
102
-
103
-
104
-
105
-
106
-
107
-
108
-
109
-
110
-
111
-
112
-
113
-
114
-
115
-
116
-
117
-
118
-
119
-
120
-
121
-
122
-
123
-
124
-
125
-
126
-
127
-
128
-
129
-
130
-
131
-
132
-
133
-
134
-
135
-
136
-
137
-
138
-
139
-
140
-
141
-
142
-
143
-
144
-
145
-
146
-
147
-
148
-
149
-
150
-
151
-
152
-
153
-
154
-
155
-
156
-
157
-
158
-
159
-
160
-
161
-
162
-
163
-
164
-
165
-
166
-
167
-
168
-
169
-
170
-
171
-
172
-
173
-
174
-
175
-
176
-
177
-
178
-
179
-
180
-
181
-
182
-
183
-
184
-
185
-
186
-
187
-
188
-
189
-
190
-
191
-
192
-
193
-
194
-
195
-
196
-
197
-
198
-
199
-
200
-
201
-
202
-
203
-
204
-
205
-
206
-
207
-
208
-
209
-
210
-
211
-
212
-
213
-
214
-
215
-
216
-
217
-
218
-
219
-
220
-
221
-
222
-
223
-
224
-
225
-
226
-
227
-
228
-
229
-
230
-
231
-
232
-
233
-
234
-
235
-
236
-
237
-
238
-
239
-
240
-
241
-
242
-
243
-
244
-
245
-
246
-
247
-
248
-
249
-
250
-
251
-
252
-
253
-
254
-
255
-
256
-
257
-
258
-
259
-
260
-
261
-
262
-
263
-
264
-
265
-
266
-
267
-
268
-
269
-
270
-
271
-
272
-
273
-
274
-
275
-
276
-
277
-
278
-
279
-
280
-
281
-
282
-
283
-
284
 |
 |

24
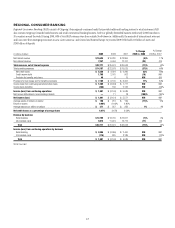
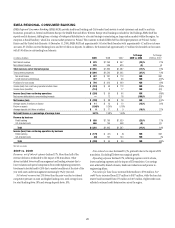
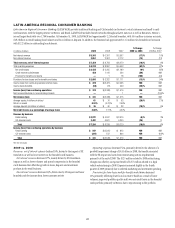
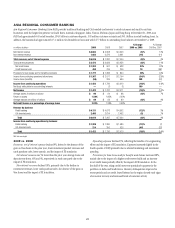
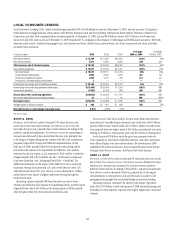
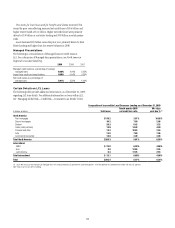
ASIA REGIONAL CONSUMER BANKING
Asia Regional Consumer Banking (Asia RCB) provides traditional banking and Citi-branded card services to retail customers and small to mid-size
businesses, with the largest Citi presence in South Korea, Australia, Singapore, India, Taiwan, Malaysia, Japan and Hong Kong. At December 31, 2009, Asia
RCB had approximately 633 retail branches, $94.5 billion in customer deposits, 15.8 million customer accounts and $50.1 billion in retail banking loans. In
addition, the business had approximately 15.1 million Citi-branded card accounts with $17.7 billion in outstanding loan balances at December 31, 2009.
In millions of dollars 2009 2008 2007
% Change
2009 vs. 2008
% Change
2008 vs. 2007
Net interest revenue $4,683 $ 4,908 $ 4,343 (5)% 13%
Non-interest revenue 1,933 2,379 2,661 (19) (11)
Total revenues, net of interest expense $6,616 $ 7,287 $ 7,004 (9)% 4%
Total operating expenses $3,472 $ 3,833 $ 3,456 (9)% 11%
Net credit losses $1,283 $ 967 $ 638 33% 52%
Credit reserve build 494 416 206 19 NM
Provisions for loan losses and for benefits and claims $1,777 $ 1,383 $ 844 28% 64%
Income from continuing operations before taxes $1,367 $ 2,071 $ 2,704 (34)% (23)%
Income taxes (benefits) (56) 335 694 NM (52)
Income from continuing operations $1,423 $ 1,736 $ 2,010 (18)% (14)%
Net (loss) attributable to noncontrolling interests —(1) (1) 100 —
Net income $1,423 $ 1,737 $ 2,011 (18)% (14)%
Average assets (in billions of dollars) $ 90 $ 94 $ 88 (4)% 7%
Return on assets 1.58% 1.85% 2.29%
Average deposits (in billions of dollars) $ 89 $ 93 $ 89 (4)% 4%
Net credit losses as a percentage of average loans 2.02% 1.38% 0.98%
Revenue by business
Retail banking $4,131 $ 4,673 $ 4,552 (12)% 3%
Citi-branded cards 2,485 2,614 2,452 (5) 7%
Total $ 6,616 $ 7,287 $ 7,004 (9)% 4%
Income from continuing operations by business
Retail banking $1,209 $ 1,380 $ 1,485 (12)% (7)
Citi-branded cards 214 356 525 (40)(32)
Total $ 1,423 $ 1,736 $ 2,010 (18)% (14)%
NM Not meaningful
2009 vs. 2008
Revenues, net of interest expense declined 9%, driven by the absence of the
gain on Visa shares in the prior year, lower investment product revenues and
cards purchase sales, lower spreads, and the impact of FX translation.
Net interest revenue was 5% lower than the prior year. Average loans and
deposits were down 10% and 4%, respectively, in each case partly due to the
impact of FX translation.
Non-interest revenue declined 19%, primarily due to the decline in
investment revenues, lower cards purchase sales, the absence of the gain on
Visa shares and the impact of FX translation.
Operating expenses declined 9%, reflecting the benefits of re-engineering
efforts and the impact of FX translation. Expenses increased slightly in the
fourth quarter of 2009 primarily due to selected marketing and investment
spending.
Provisions for loan losses and for benefits and claims increased 28%,
mainly due to the impact of a higher credit reserve build and an increase
in net credit losses partially offset by the impact of FX translation. In the
first half of the year, rising credit losses were particularly apparent in the
portfolios in India and South Korea. However, delinquencies improved in
recent periods and net credit losses flattened as the region showed early signs
of economic recovery and increased levels of customer activity.