Citibank 2009 Annual Report Download - page 116
Download and view the complete annual report
Please find page 116 of the 2009 Citibank annual report below. You can navigate through the pages in the report by either clicking on the pages listed below, or by using the keyword search tool below to find specific information within the annual report.-
 1
1 -
2
-
3
-
4
-
5
-
6
-
7
-
8
-
9
-
10
-
11
-
12
-
13
-
14
-
15
-
16
-
17
-
18
-
19
-
20
-
21
-
22
-
23
-
24
-
25
-
26
-
27
-
28
-
29
-
30
-
31
-
32
-
33
-
34
-
35
-
36
-
37
-
38
-
39
-
40
-
41
-
42
-
43
-
44
-
45
-
46
-
47
-
48
-
49
-
50
-
51
-
52
-
53
-
54
-
55
-
56
-
57
-
58
-
59
-
60
-
61
-
62
-
63
-
64
-
65
-
66
-
67
-
68
-
69
-
70
-
71
-
72
-
73
-
74
-
75
-
76
-
77
-
78
-
79
-
80
-
81
-
82
-
83
-
84
-
85
-
86
-
87
-
88
-
89
-
90
-
91
-
92
-
93
-
94
-
95
-
96
-
97
-
98
-
99
-
100
-
101
-
102
-
103
-
104
-
105
-
 106
106 -
 107
107 -
 108
108 -
 109
109 -
 110
110 -
 111
111 -
 112
112 -
 113
113 -
 114
114 -
 115
115 -
 116
116 -
 117
117 -
 118
118 -
 119
119 -
 120
120 -
 121
121 -
 122
122 -
 123
123 -
 124
124 -
 125
125 -
 126
126 -
127
-
128
-
129
-
130
-
131
-
132
-
133
-
134
-
135
-
136
-
137
-
138
-
139
-
140
-
141
-
142
-
143
-
144
-
145
-
146
-
147
-
148
-
149
-
150
-
151
-
152
-
153
-
154
-
155
-
156
-
157
-
158
-
159
-
160
-
161
-
162
-
163
-
164
-
165
-
166
-
167
-
168
-
169
-
170
-
171
-
172
-
173
-
174
-
175
-
176
-
177
-
178
-
179
-
180
-
181
-
182
-
183
-
184
-
185
-
186
-
187
-
188
-
189
-
190
-
191
-
192
-
193
-
194
-
195
-
196
-
197
-
198
-
199
-
200
-
201
-
202
-
203
-
204
-
205
-
206
-
207
-
208
-
209
-
210
-
211
-
212
-
213
-
214
-
215
-
216
-
217
-
218
-
219
-
220
-
221
-
222
-
223
-
224
-
225
-
226
-
227
-
228
-
229
-
230
-
231
-
232
-
233
-
234
-
235
-
236
-
237
-
238
-
239
-
240
-
241
-
242
-
243
-
244
-
245
-
246
-
247
-
248
-
249
-
250
-
251
-
252
-
253
-
254
-
255
-
256
-
257
-
258
-
259
-
260
-
261
-
262
-
263
-
264
-
265
-
266
-
267
-
268
-
269
-
270
-
271
-
272
-
273
-
274
-
275
-
276
-
277
-
278
-
279
-
280
-
281
-
282
-
283
-
284
 |
 |

106
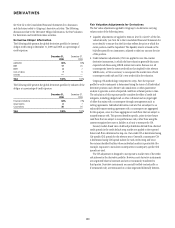
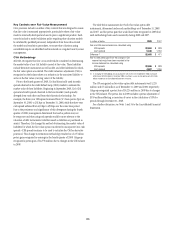
Key Controls over Fair Value Measurement
Citi’s processes include a number of key controls that are designed to ensure
that fair value is measured appropriately, particularly where a fair-value
model is internally developed and used to price a significant product. Such
controls include a model validation policy requiring that valuation models
be validated by qualified personnel, independent from those who created
the models and escalation procedures, to ensure that valuations using
unverifiable inputs are identified and monitored on a regular basis by senior
management.
CVA Methodology
ASC 820-10 requires that Citi’s own credit risk be considered in determining
the market value of any Citi liability carried at fair value. These liabilities
include derivative instruments as well as debt and other liabilities for which
the fair value option was elected. The credit valuation adjustment (CVA) is
recognized on the balance sheet as a reduction in the associated liability to
arrive at the fair value (carrying value) of the liability.
Prior to the fourth quarter of 2008, Citi had historically used its credit
spreads observed in the credit default swap (CDS) market to estimate the
market value of these liabilities. Beginning in September 2008, Citi’s CDS
spread and credit spreads observed in the bond market (cash spreads)
diverged from each other and from their historical relationship. For
example, the three-year CDS spread narrowed from 315 basis points (bps) on
September 30, 2008, to 202 bps on December 31, 2008, while the three-year
cash spread widened from 430 bps to 490 bps over the same time period.
Due to the persistence and significance of this divergence during the fourth
quarter of 2008, management determined that such a pattern may not
be temporary and that using cash spreads would be more relevant to the
valuation of debt instruments (whether issued as liabilities or purchased as
assets). Therefore, Citi changed its method of estimating the market value of
liabilities for which the fair value option was elected to incorporate Citi’s cash
spreads. (CDS spreads continue to be used to calculate the CVA for derivative
positions.) This change in estimation methodology resulted in a $2.5 billion
pretax gain recognized in earnings in the fourth quarter of 2008. Citigroup
recognized a pretax gain of $4,558 million due to changes in the CVA balance
in 2008.
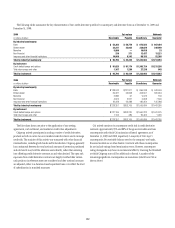
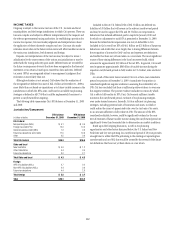
The table below summarizes the CVA for fair value option debt
instruments, determined under each methodology as of December 31, 2008
and 2007, and the pretax gain that would have been recognized in 2008 had
each methodology been used consistently during 2008 and 2007.
In millions of dollars 2008 2007
Year-end CVA reserve balance as calculated using
CDS spreads $2,953 $ 888
Cash spreads 5,446 1,359
Difference (1) $2,493 $ 471
Year-to-date pretax gain from the change in CVA
reserve that would have been recorded in the
income statement as calculated using
CDS spreads $2,065 $ 888
Cash spreads 4,087 1,359
(1) In changing the methodology for calculating the CVA reserve, Citi recorded the 2008 cumulative
difference of $2.493 billion in December 2008, resulting in a year-to-date pretax gain of $4.558
billion recorded in the Consolidated Statement of Income.
The CVA recognized on fair value option debt instruments was $1,220
million and $5,446 million as of December 31, 2009 and 2008, respectively.
Citigroup recognized a pretax loss of $4,226 million in 2009 due to changes
in the CVA balance. The pretax loss in 2009 includes a pretax adjustment of
$330 million reflecting a correction of errors in the calculation of CVA for
periods through December 31, 2008.
For a further discussion, see Notes 1 and 34 to the Consolidated Financial
Statements.