Citibank 2009 Annual Report Download - page 42
Download and view the complete annual report
Please find page 42 of the 2009 Citibank annual report below. You can navigate through the pages in the report by either clicking on the pages listed below, or by using the keyword search tool below to find specific information within the annual report.-
 1
1 -
2
-
3
-
4
-
5
-
6
-
7
-
8
-
9
-
10
-
11
-
12
-
13
-
14
-
15
-
16
-
17
-
18
-
19
-
20
-
21
-
22
-
23
-
24
-
25
-
26
-
27
-
28
-
29
-
30
-
31
-
 32
32 -
 33
33 -
 34
34 -
 35
35 -
 36
36 -
 37
37 -
 38
38 -
 39
39 -
 40
40 -
 41
41 -
 42
42 -
 43
43 -
 44
44 -
 45
45 -
 46
46 -
 47
47 -
 48
48 -
 49
49 -
 50
50 -
 51
51 -
 52
52 -
53
-
54
-
55
-
56
-
57
-
58
-
59
-
60
-
61
-
62
-
63
-
64
-
65
-
66
-
67
-
68
-
69
-
70
-
71
-
72
-
73
-
74
-
75
-
76
-
77
-
78
-
79
-
80
-
81
-
82
-
83
-
84
-
85
-
86
-
87
-
88
-
89
-
90
-
91
-
92
-
93
-
94
-
95
-
96
-
97
-
98
-
99
-
100
-
101
-
102
-
103
-
104
-
105
-
106
-
107
-
108
-
109
-
110
-
111
-
112
-
113
-
114
-
115
-
116
-
117
-
118
-
119
-
120
-
121
-
122
-
123
-
124
-
125
-
126
-
127
-
128
-
129
-
130
-
131
-
132
-
133
-
134
-
135
-
136
-
137
-
138
-
139
-
140
-
141
-
142
-
143
-
144
-
145
-
146
-
147
-
148
-
149
-
150
-
151
-
152
-
153
-
154
-
155
-
156
-
157
-
158
-
159
-
160
-
161
-
162
-
163
-
164
-
165
-
166
-
167
-
168
-
169
-
170
-
171
-
172
-
173
-
174
-
175
-
176
-
177
-
178
-
179
-
180
-
181
-
182
-
183
-
184
-
185
-
186
-
187
-
188
-
189
-
190
-
191
-
192
-
193
-
194
-
195
-
196
-
197
-
198
-
199
-
200
-
201
-
202
-
203
-
204
-
205
-
206
-
207
-
208
-
209
-
210
-
211
-
212
-
213
-
214
-
215
-
216
-
217
-
218
-
219
-
220
-
221
-
222
-
223
-
224
-
225
-
226
-
227
-
228
-
229
-
230
-
231
-
232
-
233
-
234
-
235
-
236
-
237
-
238
-
239
-
240
-
241
-
242
-
243
-
244
-
245
-
246
-
247
-
248
-
249
-
250
-
251
-
252
-
253
-
254
-
255
-
256
-
257
-
258
-
259
-
260
-
261
-
262
-
263
-
264
-
265
-
266
-
267
-
268
-
269
-
270
-
271
-
272
-
273
-
274
-
275
-
276
-
277
-
278
-
279
-
280
-
281
-
282
-
283
-
284
 |
 |

32
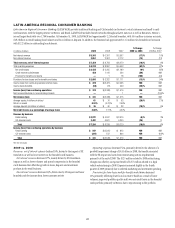
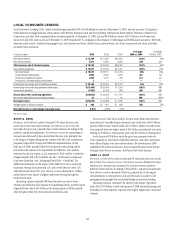
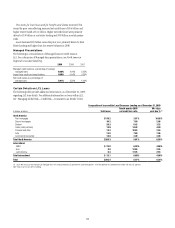
LOCAL CONSUMER LENDING
Local Consumer Lending (LCL), which constituted approximately 65% of Citi Holdings by assets as of December 31, 2009, includes a portion of Citigroup’s
North American mortgage business, retail partner cards, Western European cards and retail banking, CitiFinancial North America, Primerica, Student Loan
Corporation and other local consumer finance businesses globally. At December 31, 2009, LCL had $358 billion of assets ($317 billion in North America).
About one-half of the assets in LCL as of December 31, 2009 consisted of U.S. mortgages in the company’s CitiMortgage and CitiFinancial operations. The North
American assets consist of residential mortgage loans, retail partner card loans, student loans, personal loans, auto loans, commercial real estate, and other
consumer loans and assets.
In millions of dollars 2009 2008 2007
% Change
2009 vs. 2008
% Change
2008 vs. 2007
Net interest revenue $ 13,709 $ 17,903 $18,166 (23)% (1)%
Non-interest revenue 5,473 6,550 8,584 (16) (24)
Total revenues, net of interest expense $ 19,182 $ 24,453 $26,750 (22)% (9)%
Total operating expenses $ 10,431 $ 14,973 $11,457 (30)% 31%
Net credit losses $ 19,237 $ 13,151 $ 6,794 46% 94%
Credit reserve build/(release) 5,904 8,592 5,454 (31) 58
Provision for benefits and claims 1,055 1,191 765 (11) 56
Provision for unfunded lending commitments 3— — ——
Provisions for loan losses and for benefits and claims $ 26,199 $ 22,934 $13,013 14% 76%
Income (loss) from continuing operations before taxes $(17,448) $(13,454) $ 2,280 (30)% NM
Income taxes (benefits) (7,405) (5,200) 568 (42) NM
Income (loss) from continuing operations $(10,043) $ (8,254) $ 1,712 (22)% NM
Net income attributable to noncontrolling interests 32 12 34 NM (65)%
Net income (loss) $(10,075) $ (8,266) $ 1,678 (22)% NM
Average assets (in billions of dollars) $ 390 $ 461 $ 496 (15) (7)%
Net credit losses as a percentage of average loans 5.91% 3.56% 1.90%
NM Not meaningful
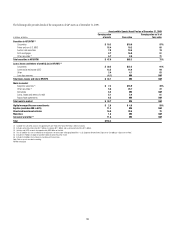
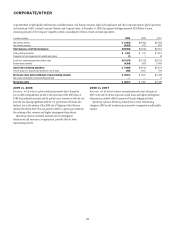
2009 vs. 2008
Revenues, net of interest expense decreased 22% versus the prior year,
mostly due to lower net interest revenue. Net interest revenue was 23%
lower than the prior year, primarily due to lower balances, de-risking of the
portfolio, and spread compression. Net interest revenue as a percentage of
average loans decreased 63 basis points from the prior year, primarily due
to the impact of higher delinquencies, interest write-offs, loan modification
programs, higher FDIC charges and CARD Act implementation (in the
latter part of 2009), partially offset by retail partner cards pricing actions.
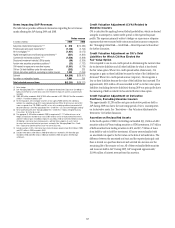
LCL results will continue to be impacted by the CARD Act. Citi currently
estimates that the net impact on LCL revenues for 2010 could be a reduction
of approximately $50 to $150 million. See also “North America Regional
Consumer Banking” and “Managing Global Risk—Credit Risk” for
additional information on the impact of the CARD Act to Citi’s credit card
businesses. Average loans decreased 12%, with North America down 11%
and international down 19%. Non-interest revenue decreased $1.1 billion
mostly driven by the impact of higher credit losses flowing through the
securitization trusts.
Operating expenses declined 30% from the prior year, due to lower
volumes and reductions from expense re-engineering actions, and the impact
of goodwill write-offs of $3.0 billion in the fourth quarter of 2008, partially
offset by higher other real estate owned and collection costs.
Provisions for loan losses and for benefits and claims increased 14%
versus the prior year reflecting an increase in net credit losses of $6.1 billion,
partially offset by lower reserve builds of $2.7 billion. Higher net credit losses
were primarily driven by higher losses of $3.6 billion in residential real estate
lending, $1.0 billion in retail partner cards, and $0.7 billion in international.
Assets decreased $58 billion versus the prior year, primarily driven by
lower originations, wind-down of specific businesses, asset sales, divestitures,
write-offs and higher loan loss reserve balances. Key divestitures in 2009
included the FI credit card business, Italy consumer finance, Diners Europe,
Portugal cards, Norway consumer, and Diners Club North America.
2008 vs. 2007
Revenues, net of interest expense decreased 9% versus the prior year, mostly
due to lower Non-interest revenue. Net interest revenue declined 1% versus
the prior year. Average loans increased 3%; however, revenues declined,
driven by lower balances, de-risking of the portfolio, and spread compression.
Non-interest revenue decreased $2 billion, primarily due to the impact
of securitization in retail partners cards and the mark-to-market on the
mortgage servicing rights asset and related hedge in real estate lending.
Operating expenses increased 31%, driven by the impact of goodwill
write-offs of $3.0 billion in the fourth quarter of 2008 and restructuring costs.
Excluding one-time expenses, expenses were slightly higher due to increased
volumes.