Citibank 2009 Annual Report Download - page 217
Download and view the complete annual report
Please find page 217 of the 2009 Citibank annual report below. You can navigate through the pages in the report by either clicking on the pages listed below, or by using the keyword search tool below to find specific information within the annual report.-
 1
1 -
2
-
3
-
4
-
5
-
6
-
7
-
8
-
9
-
10
-
11
-
12
-
13
-
14
-
15
-
16
-
17
-
18
-
19
-
20
-
21
-
22
-
23
-
24
-
25
-
26
-
27
-
28
-
29
-
30
-
31
-
32
-
33
-
34
-
35
-
36
-
37
-
38
-
39
-
40
-
41
-
42
-
43
-
44
-
45
-
46
-
47
-
48
-
49
-
50
-
51
-
52
-
53
-
54
-
55
-
56
-
57
-
58
-
59
-
60
-
61
-
62
-
63
-
64
-
65
-
66
-
67
-
68
-
69
-
70
-
71
-
72
-
73
-
74
-
75
-
76
-
77
-
78
-
79
-
80
-
81
-
82
-
83
-
84
-
85
-
86
-
87
-
88
-
89
-
90
-
91
-
92
-
93
-
94
-
95
-
96
-
97
-
98
-
99
-
100
-
101
-
102
-
103
-
104
-
105
-
106
-
107
-
108
-
109
-
110
-
111
-
112
-
113
-
114
-
115
-
116
-
117
-
118
-
119
-
120
-
121
-
122
-
123
-
124
-
125
-
126
-
127
-
128
-
129
-
130
-
131
-
132
-
133
-
134
-
135
-
136
-
137
-
138
-
139
-
140
-
141
-
142
-
143
-
144
-
145
-
146
-
147
-
148
-
149
-
150
-
151
-
152
-
153
-
154
-
155
-
156
-
157
-
158
-
159
-
160
-
161
-
162
-
163
-
164
-
165
-
166
-
167
-
168
-
169
-
170
-
171
-
172
-
173
-
174
-
175
-
176
-
177
-
178
-
179
-
180
-
181
-
182
-
183
-
184
-
185
-
186
-
187
-
188
-
189
-
190
-
191
-
192
-
193
-
194
-
195
-
196
-
197
-
198
-
199
-
200
-
201
-
202
-
203
-
204
-
205
-
206
-
 207
207 -
 208
208 -
 209
209 -
 210
210 -
 211
211 -
 212
212 -
 213
213 -
 214
214 -
 215
215 -
 216
216 -
 217
217 -
 218
218 -
 219
219 -
 220
220 -
 221
221 -
 222
222 -
 223
223 -
 224
224 -
 225
225 -
 226
226 -
 227
227 -
228
-
229
-
230
-
231
-
232
-
233
-
234
-
235
-
236
-
237
-
238
-
239
-
240
-
241
-
242
-
243
-
244
-
245
-
246
-
247
-
248
-
249
-
250
-
251
-
252
-
253
-
254
-
255
-
256
-
257
-
258
-
259
-
260
-
261
-
262
-
263
-
264
-
265
-
266
-
267
-
268
-
269
-
270
-
271
-
272
-
273
-
274
-
275
-
276
-
277
-
278
-
279
-
280
-
281
-
282
-
283
-
284
 |
 |

207
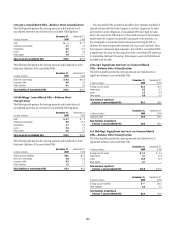
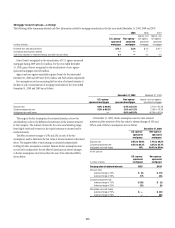
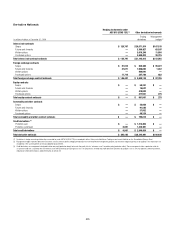
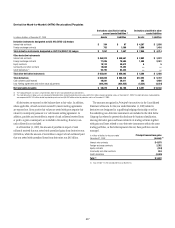
Mortgage Servicing Rights
The fair value of capitalized mortgage servicing rights (MSRs) was
$6.5 billion and $5.7 billion at December 31, 2009 and 2008, respectively.
The MSRs correspond to principal loan balances of $555 billion and
$662 billion as of December 31, 2009 and 2008, respectively. The following
table summarizes the changes in capitalized MSRs for the years ended
December 31, 2009 and 2008:
In millions of dollars 2009 2008
Balance, beginning of year $ 5,657 $ 8,380
Originations 1,035 1,311
Purchases —1
Changes in fair value of MSRs due to changes
in inputs and assumptions 1,546 (2,682)
Transfer to Trading account assets —(163)
Other changes (1) (1,708) (1,190)
Balance, end of year $ 6,530 $ 5,657
(1) Represents changes due to customer payments and passage of time.
The market for MSRs is not sufficiently liquid to provide participants
with quoted market prices. Therefore, the Company uses an option-adjusted
spread valuation approach to determine the fair value of MSRs. This
approach consists of projecting servicing cash flows under multiple interest
rate scenarios and discounting these cash flows using risk-adjusted discount
rates. The key assumptions used in the valuation of MSRs include mortgage
prepayment speeds and discount rates. The model assumptions and the
MSRs’ fair value estimates are compared to observable trades of similar MSR
portfolios and interest-only security portfolios, as available, as well as to MSR
broker valuations and industry surveys. The cash flow model and underlying
prepayment and interest rate models used to value these MSRs are subject to
validation in accordance with the Company’s model validation policies.
The fair value of the MSRs is primarily affected by changes in
prepayments that result from shifts in mortgage interest rates. In managing
this risk, the Company economically hedges a significant portion of the
value of its MSRs through the use of interest rate derivative contracts, forward
purchase commitments of mortgage-backed securities and purchased
securities classified as trading.
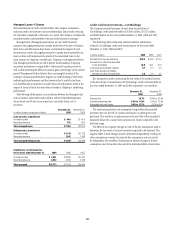
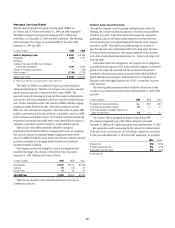
The Company receives fees during the course of servicing previously
securitized mortgages. The amounts of these fees for the years ended
December 31, 2009, 2008 and 2007 were as follows:
In millions of dollars 2009 2008 2007
Servicing fees $1,635 $2,121 $1,683
Late fees 93 123 90
Ancillary fees 77 81 61
Total MSR fees $1,805 $2,325 $1,834
These fees are classified in the Consolidated Statement of Income as
Commissions and fees.
Student Loan Securitizations
Through the Company’s Local Consumer Lending business within Citi
Holdings, the Company maintains programs to securitize certain portfolios
of student loan assets. Under these securitization programs, transactions
qualifying as sales are off-balance-sheet transactions in which the loans
are removed from the Consolidated Financial Statements of the Company
and sold to a QSPE. These QSPEs are funded through the issuance of
pass-through term notes collateralized solely by the trust assets. For these
off-balance-sheet securitizations, the Company generally retains interests
in the form of subordinated residual interests (i.e., interest-only strips) and
servicing rights.
Under terms of the trust arrangements, the Company has no obligations
to provide financial support and has not provided such support. A substantial
portion of the credit risk associated with the securitized loans has been
transferred to third-party guarantors or insurers either under the Federal
Family Education Loan Program, authorized by the U.S. Department of
Education under the Higher Education Act of 1965, as amended, or private
credit insurance.
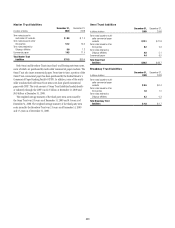
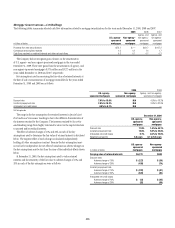
The following tables summarize selected cash flow information related
to student loan securitizations for the years ended December 31, 2009, 2008
and 2007:
In billions of dollars 2009 2008 2007
Proceeds from new securitizations $— $2.0 $2.9
Contractual servicing fees received 0.1 0.1 0.1
Cash flows received on retained interests and
other net cash flows 0.2 0.1 0.1
The Company did not recognize any gains or losses during 2009.
The Company recognized a gain of $1 million during the year ended
December 31, 2008 and $71 million during the year ended December 31, 2007.
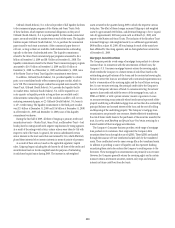
Key assumptions used in measuring the fair value of the residual interest
at the date of sale or securitization of Citi Holdings’ student loan receivables
for the years ended December 31, 2009 and 2008, respectively, are as follows:
2009 2008
Discount rate N/A 10.6%
Constant prepayment rate N/A 9.0%
Anticipated net credit losses N/A 0.5%
N/A Not applicable