Citibank 2009 Annual Report Download - page 28
Download and view the complete annual report
Please find page 28 of the 2009 Citibank annual report below. You can navigate through the pages in the report by either clicking on the pages listed below, or by using the keyword search tool below to find specific information within the annual report.-
 1
1 -
2
-
3
-
4
-
5
-
6
-
7
-
8
-
9
-
10
-
11
-
12
-
13
-
14
-
15
-
16
-
17
-
 18
18 -
 19
19 -
 20
20 -
 21
21 -
 22
22 -
 23
23 -
 24
24 -
 25
25 -
 26
26 -
 27
27 -
 28
28 -
 29
29 -
 30
30 -
 31
31 -
 32
32 -
 33
33 -
 34
34 -
 35
35 -
 36
36 -
 37
37 -
 38
38 -
39
-
40
-
41
-
42
-
43
-
44
-
45
-
46
-
47
-
48
-
49
-
50
-
51
-
52
-
53
-
54
-
55
-
56
-
57
-
58
-
59
-
60
-
61
-
62
-
63
-
64
-
65
-
66
-
67
-
68
-
69
-
70
-
71
-
72
-
73
-
74
-
75
-
76
-
77
-
78
-
79
-
80
-
81
-
82
-
83
-
84
-
85
-
86
-
87
-
88
-
89
-
90
-
91
-
92
-
93
-
94
-
95
-
96
-
97
-
98
-
99
-
100
-
101
-
102
-
103
-
104
-
105
-
106
-
107
-
108
-
109
-
110
-
111
-
112
-
113
-
114
-
115
-
116
-
117
-
118
-
119
-
120
-
121
-
122
-
123
-
124
-
125
-
126
-
127
-
128
-
129
-
130
-
131
-
132
-
133
-
134
-
135
-
136
-
137
-
138
-
139
-
140
-
141
-
142
-
143
-
144
-
145
-
146
-
147
-
148
-
149
-
150
-
151
-
152
-
153
-
154
-
155
-
156
-
157
-
158
-
159
-
160
-
161
-
162
-
163
-
164
-
165
-
166
-
167
-
168
-
169
-
170
-
171
-
172
-
173
-
174
-
175
-
176
-
177
-
178
-
179
-
180
-
181
-
182
-
183
-
184
-
185
-
186
-
187
-
188
-
189
-
190
-
191
-
192
-
193
-
194
-
195
-
196
-
197
-
198
-
199
-
200
-
201
-
202
-
203
-
204
-
205
-
206
-
207
-
208
-
209
-
210
-
211
-
212
-
213
-
214
-
215
-
216
-
217
-
218
-
219
-
220
-
221
-
222
-
223
-
224
-
225
-
226
-
227
-
228
-
229
-
230
-
231
-
232
-
233
-
234
-
235
-
236
-
237
-
238
-
239
-
240
-
241
-
242
-
243
-
244
-
245
-
246
-
247
-
248
-
249
-
250
-
251
-
252
-
253
-
254
-
255
-
256
-
257
-
258
-
259
-
260
-
261
-
262
-
263
-
264
-
265
-
266
-
267
-
268
-
269
-
270
-
271
-
272
-
273
-
274
-
275
-
276
-
277
-
278
-
279
-
280
-
281
-
282
-
283
-
284
 |
 |

18
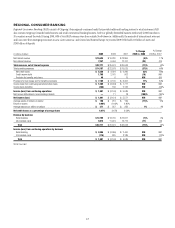
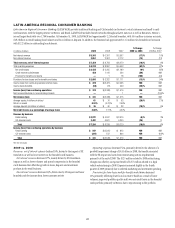
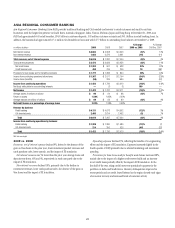
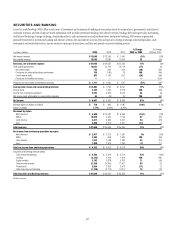
NORTH AMERICA REGIONAL CONSUMER BANKING
North America Regional Consumer Banking (NA RCB) provides traditional banking and Citi-branded card services to retail customers and small to
mid-size businesses in the U.S. NA RCB’s approximately 1,000 retail bank branches and 12 million retail customer accounts are largely concentrated in the
greater metropolitan areas of New York, Los Angeles, San Francisco, Chicago, Miami, Washington, D.C., Boston, Philadelphia, and the larger cities in Texas.
At December 31, 2009, NA RCB had approximately $7.2 billion of retail banking loans and $143.7 billion of deposits. In addition, NA RCB had approximately
23.1 million Citi-branded credit card accounts, with $82.7 billion in outstanding loan balances on a managed basis.
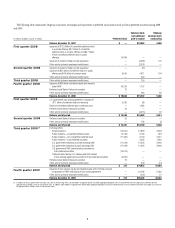
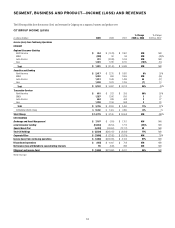
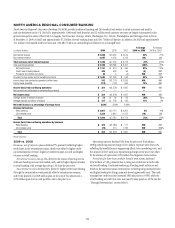
In millions of dollars 2009 2008 2007
% Change
2009 vs. 2008
% Change
2008 vs. 2007
Net interest revenue $ 4,559 $ 3,662 $ 3,019 24% 21%
Non-interest revenue 2,687 4,102 6,754 (34) (39)
Total revenues, net of interest expense $ 7,246 $ 7,764 $ 9,773 (7)% (21)%
Total operating expenses $ 5,359 $ 8,388 $ 6,401 (36)% 31%
Net credit losses $ 1,151 $ 615 $ 450 87% 37%
Credit reserve build/(release) 446 463 96 (4) NM
Provisions for benefits and claims 48 5 (3) NM NM
Provision for loan losses and for benefits and claims $ 1,645 $ 1,083 $ 543 52% 99%
Income (loss) from continuing operations before taxes 242 $(1,707) $ 2,829 NM NM
Income taxes (benefits) (112) (129) 962 13% NM
Income (loss) from continuing operations $ 354 $(1,578) $ 1,867 NM NM
Net income (loss) attributable to noncontrolling interests —— — ——
Net income (loss) $ 354 $(1,578) $ 1,867 NM NM
Average assets (in billions of dollars) $ 34 $ 36 $ 39 (6)% (8)%
Average deposits (in billions of dollars) $ 137 $ 123 $ 120 11% 3%
Net credit losses as a percentage of average loans 5.84% 3.60% 2.68%
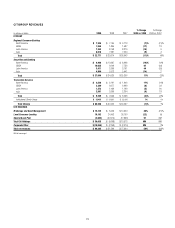
Revenue by business
Retail banking $ 3,907 $ 3,770 $ 3,301 4% 14%
Citi-branded cards 3,339 3,994 6,472 (16) (38)
Total $ 7,246 $ 7,764 $ 9,773 (7)% (21)%
Income (loss) from continuing operations by business
Retail banking $ 429 $(1,788) $ 111 NM NM
Citi-branded cards (75) 210 1,756 NM (88)%
Total $ 354 $(1,578) $ 1,867 NM NM
NM Not meaningful
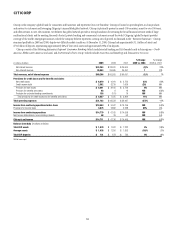
2009 vs. 2008
Revenues, net of interest expense declined 7%, primarily reflecting higher
credit losses in the securitization trusts, which were offset by higher credit-
card-securitization revenue, higher net interest margin in cards and higher
volumes in retail banking.
Net interest revenue was up 24%, driven by the impact of pricing actions
and lower funding costs in Citi-branded cards, and by higher deposit volumes
in retail banking, with average deposits up 11% from the prior year.
Non-interest revenue declined 34%, driven by higher credit losses flowing
through the securitization trusts partially offset by securitization revenue,
and by the absence of a $349 million gain on the sale of Visa shares and a
$170 million gain from a cards portfolio sale in the prior year.
Operating expenses declined 36% from the prior year. Excluding a
2008 goodwill impairment charge of $2.3 billion, expenses were down 12%
reflecting the benefits from re-engineering efforts, lower marketing costs, and
the absence of $217 million in repositioning charges in the prior year offset
by the absence of a prior-year $159 million Visa litigation reserve release.
Provisions for loan losses and for benefits and claims increased
$562 million, or 52%, primarily due to rising net credit losses in both cards
and retail banking. Continued weakening of leading credit indicators and
trends in the macroeconomic environment, including rising unemployment
and higher bankruptcy filings, primarily drove higher credit costs. The cards
managed net credit loss ratio increased 386 basis points to 9.58%, while the
retail banking net credit loss ratio increased 75 basis points to 4.29% (see the
“Managed Presentations” section below).