Citibank 2009 Annual Report Download - page 206
Download and view the complete annual report
Please find page 206 of the 2009 Citibank annual report below. You can navigate through the pages in the report by either clicking on the pages listed below, or by using the keyword search tool below to find specific information within the annual report.-
 1
1 -
2
-
3
-
4
-
5
-
6
-
7
-
8
-
9
-
10
-
11
-
12
-
13
-
14
-
15
-
16
-
17
-
18
-
19
-
20
-
21
-
22
-
23
-
24
-
25
-
26
-
27
-
28
-
29
-
30
-
31
-
32
-
33
-
34
-
35
-
36
-
37
-
38
-
39
-
40
-
41
-
42
-
43
-
44
-
45
-
46
-
47
-
48
-
49
-
50
-
51
-
52
-
53
-
54
-
55
-
56
-
57
-
58
-
59
-
60
-
61
-
62
-
63
-
64
-
65
-
66
-
67
-
68
-
69
-
70
-
71
-
72
-
73
-
74
-
75
-
76
-
77
-
78
-
79
-
80
-
81
-
82
-
83
-
84
-
85
-
86
-
87
-
88
-
89
-
90
-
91
-
92
-
93
-
94
-
95
-
96
-
97
-
98
-
99
-
100
-
101
-
102
-
103
-
104
-
105
-
106
-
107
-
108
-
109
-
110
-
111
-
112
-
113
-
114
-
115
-
116
-
117
-
118
-
119
-
120
-
121
-
122
-
123
-
124
-
125
-
126
-
127
-
128
-
129
-
130
-
131
-
132
-
133
-
134
-
135
-
136
-
137
-
138
-
139
-
140
-
141
-
142
-
143
-
144
-
145
-
146
-
147
-
148
-
149
-
150
-
151
-
152
-
153
-
154
-
155
-
156
-
157
-
158
-
159
-
160
-
161
-
162
-
163
-
164
-
165
-
166
-
167
-
168
-
169
-
170
-
171
-
172
-
173
-
174
-
175
-
176
-
177
-
178
-
179
-
180
-
181
-
182
-
183
-
184
-
185
-
186
-
187
-
188
-
189
-
190
-
191
-
192
-
193
-
194
-
195
-
 196
196 -
 197
197 -
 198
198 -
 199
199 -
 200
200 -
 201
201 -
 202
202 -
 203
203 -
 204
204 -
 205
205 -
 206
206 -
 207
207 -
 208
208 -
 209
209 -
 210
210 -
 211
211 -
 212
212 -
 213
213 -
 214
214 -
 215
215 -
 216
216 -
217
-
218
-
219
-
220
-
221
-
222
-
223
-
224
-
225
-
226
-
227
-
228
-
229
-
230
-
231
-
232
-
233
-
234
-
235
-
236
-
237
-
238
-
239
-
240
-
241
-
242
-
243
-
244
-
245
-
246
-
247
-
248
-
249
-
250
-
251
-
252
-
253
-
254
-
255
-
256
-
257
-
258
-
259
-
260
-
261
-
262
-
263
-
264
-
265
-
266
-
267
-
268
-
269
-
270
-
271
-
272
-
273
-
274
-
275
-
276
-
277
-
278
-
279
-
280
-
281
-
282
-
283
-
284
 |
 |

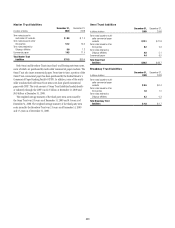
196
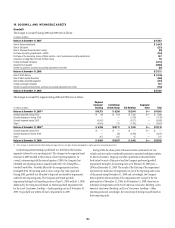
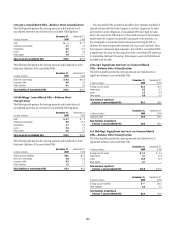
Citigroup’s involvement with QSPEs and consolidated and unconsolidated VIEs with which the Company holds significant variable interests as of
December 31, 2009 and 2008 is presented below:
In millions of dollars As of December 31, 2009
Maximum exposure to loss in significant
unconsolidated VIEs
(1)
Funded exposures (2) Unfunded exposures
(3)
Total
involvement
with SPE
assets
QSPE
assets
Consolidated
VIE assets
Significant
unconsolidated
VIE assets
(4)
Debt
investments
Equity
investments
Funding
commitments
Guarantees
and
derivatives
Citicorp
Credit card securitizations $ 78,833 $ 78,833 $ — $ — $ — $ — $ — $ —
Mortgage securitizations 81,953 81,953 — — — — — —
Citi-administered asset-backed
commercial paper conduits (ABCP) 22,648 — — 22,648 70 — 22,204 374
Third-party commercial paper conduits 3,718 — — 3,718 — — 353 —
Collateralized debt obligations (CDOs) 2,785 — — 2,785 21 — — —
Collateralized loan obligations (CLOs) 5,409 — — 5,409 120 — — —
Asset-based financing 19,612 — 1,279 18,333 4,469 44 549 159
Municipal securities tender
option bond trusts (TOBs) 19,455 705 9,623 9,127 — — 6,304 537
Municipal investments 225 — 11 214 206 13 18 —
Client intermediation 8,607 — 2,749 5,858 881 — — —
Investment funds 93 — 39 54 9 — — 1
Trust preferred securities 19,345 — — 19,345 — 128 — —
Other 7,380 1,808 1,838 3,734 365 — 33 48
Total $270,063 $163,299 $15,539 $ 91,225 $ 6,141 $185 $29,461 $1,119
Citi Holdings
Credit card securitizations $ 42,274 $ 42,274 $ — $ — $ — $ — $ — $ —
Mortgage securitizations 491,500 491,500 — — — — — —
Student loan securitizations 14,343 14,343 — — — — — —
Citi-administered asset-backed
commercial paper conduits (ABCP) 13,777 — 98 13,679 — — 13,660 18
Third-party commercial paper conduits 5,776 — — 5,776 187 — 252 —
Collateralized debt obligations (CDOs) 24,157 — 7,614 16,543 930 — — 228
Collateralized loan obligations (CLOs) 13,515 — 142 13,373 1,357 — 19 282
Asset-based financing 52,598 — 370 52,228 17,006 68 1,311 —
Municipal securities tender
option bond trusts (TOBs) 1,999 — 1,999 — — — — —
Municipal investments 16,045 — 882 15,163 85 2,037 386 —
Client intermediation 675 — 230 445 43 — — 353
Investment funds 10,178 — 1,037 9,141 — 175 93 —
Other 3,732 610 1,472 1,650 235 112 257 —
Total $690,569 $548,727 $13,844 $127,998 $19,843 $ 2,392 $15,978 $ 881
Total Citigroup $960,632 $712,026 $29,383 $219,223 $25,984 $ 2,577 $45,439 $2,000
(1) The definition of maximum exposure to loss is included in the text that follows.
(2) Included in Citigroup’s December 31, 2009 Consolidated Balance Sheet.
(3) Not included in Citigroup’s December 31, 2009 Consolidated Balance Sheet. See “Future Applications of Accounting Standards” in Note 1 to the Consolidated Financial Statements for discussion of the impact of
implementation of SFAS 166 and SFAS 167, which will cause the maximum exposure to loss in Significant unconsolidated VIEs to decrease significantly.
(4) A significant unconsolidated VIE is an entity where the Company has any variable interest considered to be significant, regardless of the likelihood of loss or the notional amount of exposure.