Citibank 2009 Annual Report Download - page 227
Download and view the complete annual report
Please find page 227 of the 2009 Citibank annual report below. You can navigate through the pages in the report by either clicking on the pages listed below, or by using the keyword search tool below to find specific information within the annual report.-
 1
1 -
2
-
3
-
4
-
5
-
6
-
7
-
8
-
9
-
10
-
11
-
12
-
13
-
14
-
15
-
16
-
17
-
18
-
19
-
20
-
21
-
22
-
23
-
24
-
25
-
26
-
27
-
28
-
29
-
30
-
31
-
32
-
33
-
34
-
35
-
36
-
37
-
38
-
39
-
40
-
41
-
42
-
43
-
44
-
45
-
46
-
47
-
48
-
49
-
50
-
51
-
52
-
53
-
54
-
55
-
56
-
57
-
58
-
59
-
60
-
61
-
62
-
63
-
64
-
65
-
66
-
67
-
68
-
69
-
70
-
71
-
72
-
73
-
74
-
75
-
76
-
77
-
78
-
79
-
80
-
81
-
82
-
83
-
84
-
85
-
86
-
87
-
88
-
89
-
90
-
91
-
92
-
93
-
94
-
95
-
96
-
97
-
98
-
99
-
100
-
101
-
102
-
103
-
104
-
105
-
106
-
107
-
108
-
109
-
110
-
111
-
112
-
113
-
114
-
115
-
116
-
117
-
118
-
119
-
120
-
121
-
122
-
123
-
124
-
125
-
126
-
127
-
128
-
129
-
130
-
131
-
132
-
133
-
134
-
135
-
136
-
137
-
138
-
139
-
140
-
141
-
142
-
143
-
144
-
145
-
146
-
147
-
148
-
149
-
150
-
151
-
152
-
153
-
154
-
155
-
156
-
157
-
158
-
159
-
160
-
161
-
162
-
163
-
164
-
165
-
166
-
167
-
168
-
169
-
170
-
171
-
172
-
173
-
174
-
175
-
176
-
177
-
178
-
179
-
180
-
181
-
182
-
183
-
184
-
185
-
186
-
187
-
188
-
189
-
190
-
191
-
192
-
193
-
194
-
195
-
196
-
197
-
198
-
199
-
200
-
201
-
202
-
203
-
204
-
205
-
206
-
207
-
208
-
209
-
210
-
211
-
212
-
213
-
214
-
215
-
216
-
 217
217 -
 218
218 -
 219
219 -
 220
220 -
 221
221 -
 222
222 -
 223
223 -
 224
224 -
 225
225 -
 226
226 -
 227
227 -
 228
228 -
 229
229 -
 230
230 -
 231
231 -
 232
232 -
 233
233 -
 234
234 -
 235
235 -
 236
236 -
 237
237 -
238
-
239
-
240
-
241
-
242
-
243
-
244
-
245
-
246
-
247
-
248
-
249
-
250
-
251
-
252
-
253
-
254
-
255
-
256
-
257
-
258
-
259
-
260
-
261
-
262
-
263
-
264
-
265
-
266
-
267
-
268
-
269
-
270
-
271
-
272
-
273
-
274
-
275
-
276
-
277
-
278
-
279
-
280
-
281
-
282
-
283
-
284
 |
 |

217
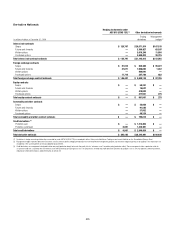
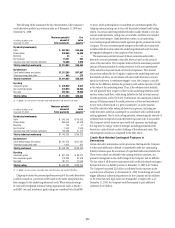
Derivative Mark-to-Market (MTM) Receivables/Payables
Derivatives classified in trading
account assets/liabilities (1)
Derivatives classified in other
assets/liabilities
In millions of dollars at December 31, 2009 Assets Liabilities Assets Liabilities
Derivative instruments designated as ASC 815 (SFAS 133) hedges
Interest rate contracts $ 304 $ 87 $ 4,267 $ 2,898
Foreign exchange contracts 753 1,580 3,599 1,416
Total derivative instruments designated as ASC 815 (SFAS 133) hedges $ 1,057 $ 1,667 $ 7,866 $ 4,314
Other derivative instruments
Interest rate contracts $ 454,974 $ 449,551 $ 2,882 $ 3,022
Foreign exchange contracts 71,005 70,584 1,498 2,381
Equity contracts 18,132 40,612 6 5
Commodity and other contracts 16,698 15,492 — —
Credit derivatives (2) 92,792 82,424 — —
Total other derivative instruments $ 653,601 $ 658,663 $ 4,386 $ 5,408
Total derivatives $ 654,658 $ 660,330 $12,252 $ 9,722
Cash collateral paid/received 48,561 38,611 263 4,950
Less: Netting agreements and market value adjustments (644,340) (634,835) (4,224) (4,224)
Net receivables/payables $ 58,879 $ 64,106 $ 8,291 $ 10,448
(1) The trading derivatives fair values are presented in Note 15 to the Consolidated Financial Statements.
(2) The credit derivatives trading assets are composed of $68,558 million related to protection purchased and $24,234 million related to protection sold as of December 31, 2009. The credit derivatives trading liabilities
are composed of $24,162 million related to protection purchased and $58,262 million related to protection sold as of December 31, 2009.
All derivatives are reported on the balance sheet at fair value. In addition,
where applicable, all such contracts covered by master netting agreements
are reported net. Gross positive fair values are netted with gross negative fair
values by counterparty pursuant to a valid master netting agreement. In
addition, payables and receivables in respect of cash collateral received from
or paid to a given counterparty are included in this netting. However, non-
cash collateral is not included.
As of December 31, 2009, the amount of payables in respect of cash
collateral received that was netted with unrealized gains from derivatives was
$30 billion, while the amount of receivables in respect of cash collateral paid
that was netted with unrealized losses from derivatives was $41 billion.
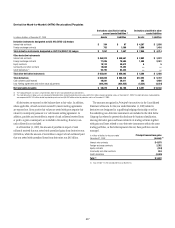
The amounts recognized in Principal transactions in the Consolidated
Statement of Income for the year ended December 31, 2009 related to
derivatives not designated in a qualifying hedging relationship as well as
the underlying non-derivative instruments are included in the table below.
Citigroup has elected to present this disclosure by business classification,
showing derivative gains and losses related to its trading activities together
with gains and losses related to non-derivative instruments within the same
trading portfolios, as this better represents the way these portfolios are risk
managed.
In millions of dollars for the year ended
December 31, 2009
Principal transactions gains
(losses) (1)
Interest rate contracts $ 4,075
Foreign exchange contracts 2,762
Equity contracts (334)
Commodity and other contracts 924
Credit derivatives (3,495)
Total (1) $ 3,932
(1) Also see Note 7 to the Consolidated Financial Statements.