Citibank 2009 Annual Report Download - page 236
Download and view the complete annual report
Please find page 236 of the 2009 Citibank annual report below. You can navigate through the pages in the report by either clicking on the pages listed below, or by using the keyword search tool below to find specific information within the annual report.-
 1
1 -
2
-
3
-
4
-
5
-
6
-
7
-
8
-
9
-
10
-
11
-
12
-
13
-
14
-
15
-
16
-
17
-
18
-
19
-
20
-
21
-
22
-
23
-
24
-
25
-
26
-
27
-
28
-
29
-
30
-
31
-
32
-
33
-
34
-
35
-
36
-
37
-
38
-
39
-
40
-
41
-
42
-
43
-
44
-
45
-
46
-
47
-
48
-
49
-
50
-
51
-
52
-
53
-
54
-
55
-
56
-
57
-
58
-
59
-
60
-
61
-
62
-
63
-
64
-
65
-
66
-
67
-
68
-
69
-
70
-
71
-
72
-
73
-
74
-
75
-
76
-
77
-
78
-
79
-
80
-
81
-
82
-
83
-
84
-
85
-
86
-
87
-
88
-
89
-
90
-
91
-
92
-
93
-
94
-
95
-
96
-
97
-
98
-
99
-
100
-
101
-
102
-
103
-
104
-
105
-
106
-
107
-
108
-
109
-
110
-
111
-
112
-
113
-
114
-
115
-
116
-
117
-
118
-
119
-
120
-
121
-
122
-
123
-
124
-
125
-
126
-
127
-
128
-
129
-
130
-
131
-
132
-
133
-
134
-
135
-
136
-
137
-
138
-
139
-
140
-
141
-
142
-
143
-
144
-
145
-
146
-
147
-
148
-
149
-
150
-
151
-
152
-
153
-
154
-
155
-
156
-
157
-
158
-
159
-
160
-
161
-
162
-
163
-
164
-
165
-
166
-
167
-
168
-
169
-
170
-
171
-
172
-
173
-
174
-
175
-
176
-
177
-
178
-
179
-
180
-
181
-
182
-
183
-
184
-
185
-
186
-
187
-
188
-
189
-
190
-
191
-
192
-
193
-
194
-
195
-
196
-
197
-
198
-
199
-
200
-
201
-
202
-
203
-
204
-
205
-
206
-
207
-
208
-
209
-
210
-
211
-
212
-
213
-
214
-
215
-
216
-
217
-
218
-
219
-
220
-
221
-
222
-
223
-
224
-
225
-
 226
226 -
 227
227 -
 228
228 -
 229
229 -
 230
230 -
 231
231 -
 232
232 -
 233
233 -
 234
234 -
 235
235 -
 236
236 -
 237
237 -
 238
238 -
 239
239 -
 240
240 -
 241
241 -
 242
242 -
 243
243 -
 244
244 -
 245
245 -
 246
246 -
247
-
248
-
249
-
250
-
251
-
252
-
253
-
254
-
255
-
256
-
257
-
258
-
259
-
260
-
261
-
262
-
263
-
264
-
265
-
266
-
267
-
268
-
269
-
270
-
271
-
272
-
273
-
274
-
275
-
276
-
277
-
278
-
279
-
280
-
281
-
282
-
283
-
284
 |
 |
226
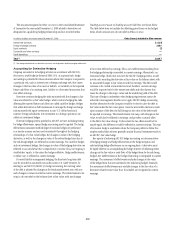
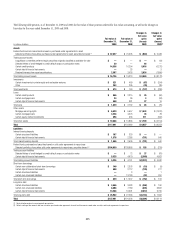
Short-term borrowings and long-term debt
Where fair value accounting has been elected, the fair value of non-
structured liabilities is determined by discounting expected cash flows using
the appropriate discount rate for the applicable maturity. Such instruments
are generally classified as Level 2 of the fair value hierarchy as all inputs are
readily observable.
The Company determines the fair value of structured liabilities (where
performance is linked to structured interest rates, inflation or currency risks)
and hybrid financial instruments (performance linked to risks other than
interest rates, inflation or currency risks) using the appropriate derivative
valuation methodology (described above) given the nature of the embedded
risk profile. Such instruments are classified as Level 2 or Level 3 depending
on the observability of significant inputs to the model.
Market valuation adjustments
Liquidity adjustments are applied to items in Level 2 and Level 3 of the fair
value hierarchy to ensure that the fair value reflects the price at which the
entire position could be liquidated. The liquidity reserve is based on the
bid-offer spread for an instrument, adjusted to take into account the size of
the position.
Counterparty credit-risk adjustments are applied to derivatives, such
as over-the-counter derivatives, where the base valuation uses market
parameters based on the LIBOR interest rate curves. Not all counterparties
have the same credit risk as that implied by the relevant LIBOR curve, so it is
necessary to consider the market view of the credit risk of a counterparty in
order to estimate the fair value of such an item.
Bilateral or “own” credit-risk adjustments are applied to reflect the
Company’s own credit risk when valuing derivatives and liabilities measured
at fair value. Counterparty and own credit adjustments consider the expected
future cash flows between Citi and its counterparties under the terms of
the instrument and the effect of credit risk on the valuation of those cash
flows, rather than a point-in-time assessment of the current recognized net
asset or liability. Furthermore, the credit-risk adjustments take into account
the effect of credit-risk mitigants, such as pledged collateral and any legal
right of offset (to the extent such offset exists) with a counterparty through
arrangements such as netting agreements.
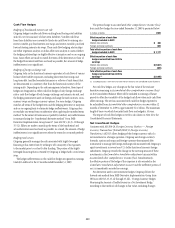
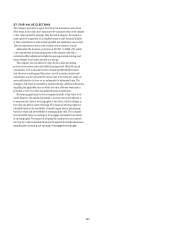
Auction rate securities
Auction rate securities (ARS) are long-term municipal bonds, corporate
bonds, securitizations and preferred stocks with interest rates or dividend
yields that are reset through periodic auctions. The coupon paid in the
current period is based on the rate determined by the prior auction. In the
event of an auction failure, ARS holders receive a “fail rate” coupon, which is
specified by the original issue documentation of each ARS.
Where insufficient orders to purchase all of the ARS issue to be sold
in an auction were received, the primary dealer or auction agent would
traditionally have purchased any residual unsold inventory (without a
contractual obligation to do so). This residual inventory would then be
repaid through subsequent auctions, typically in a short timeframe. Due to
this auction mechanism and generally liquid market, ARS have historically
traded and were valued as short-term instruments.
Citigroup acted in the capacity of primary dealer for approximately
$72 billion of ARS and continued to purchase residual unsold inventory in
support of the auction mechanism until mid-February 2008. After this date,
liquidity in the ARS market deteriorated significantly, auctions failed due to
a lack of bids from third-party investors, and Citigroup ceased to purchase
unsold inventory. Following a number of ARS refinancings, at December 31,
2009, Citigroup continued to act in the capacity of primary dealer for
approximately $28.2 billion of outstanding ARS.
The Company classifies its ARS as held-to-maturity, available-for-sale and
trading securities.
Prior to the Company’s first auction’s failing in the first quarter of 2008,
Citigroup valued ARS based on observation of auction market prices, because
the auctions had a short maturity period (7, 28 and 35 days). This generally
resulted in valuations at par. Once the auctions failed, ARS could no longer
be valued using observation of auction market prices. Accordingly, the fair
value of ARS is currently estimated using internally developed discounted
cash flow valuation techniques specific to the nature of the assets underlying
each ARS.
For ARS with U.S. municipal securities as underlying assets, future cash flows
are estimated based on the terms of the securities underlying each individual
ARS and discounted at an estimated discount rate in order to estimate the current
fair value. The key assumptions that impact the ARS valuations are estimated
prepayments and refinancings, estimated fail rate coupons (i.e., the rate paid
in the event of auction failure, which varies according to the current credit
rating of the issuer) and the discount rate used to calculate the present value
of projected cash flows. The discount rate used for each ARS is based on rates
observed for straight issuances of other municipal securities. In order to arrive at
the appropriate discount rate, these observed rates were adjusted upward to factor
in the specifics of the ARS structure being valued, such as callability, and the
illiquidity in the ARS market.