Citibank 2009 Annual Report Download - page 223
Download and view the complete annual report
Please find page 223 of the 2009 Citibank annual report below. You can navigate through the pages in the report by either clicking on the pages listed below, or by using the keyword search tool below to find specific information within the annual report.-
 1
1 -
2
-
3
-
4
-
5
-
6
-
7
-
8
-
9
-
10
-
11
-
12
-
13
-
14
-
15
-
16
-
17
-
18
-
19
-
20
-
21
-
22
-
23
-
24
-
25
-
26
-
27
-
28
-
29
-
30
-
31
-
32
-
33
-
34
-
35
-
36
-
37
-
38
-
39
-
40
-
41
-
42
-
43
-
44
-
45
-
46
-
47
-
48
-
49
-
50
-
51
-
52
-
53
-
54
-
55
-
56
-
57
-
58
-
59
-
60
-
61
-
62
-
63
-
64
-
65
-
66
-
67
-
68
-
69
-
70
-
71
-
72
-
73
-
74
-
75
-
76
-
77
-
78
-
79
-
80
-
81
-
82
-
83
-
84
-
85
-
86
-
87
-
88
-
89
-
90
-
91
-
92
-
93
-
94
-
95
-
96
-
97
-
98
-
99
-
100
-
101
-
102
-
103
-
104
-
105
-
106
-
107
-
108
-
109
-
110
-
111
-
112
-
113
-
114
-
115
-
116
-
117
-
118
-
119
-
120
-
121
-
122
-
123
-
124
-
125
-
126
-
127
-
128
-
129
-
130
-
131
-
132
-
133
-
134
-
135
-
136
-
137
-
138
-
139
-
140
-
141
-
142
-
143
-
144
-
145
-
146
-
147
-
148
-
149
-
150
-
151
-
152
-
153
-
154
-
155
-
156
-
157
-
158
-
159
-
160
-
161
-
162
-
163
-
164
-
165
-
166
-
167
-
168
-
169
-
170
-
171
-
172
-
173
-
174
-
175
-
176
-
177
-
178
-
179
-
180
-
181
-
182
-
183
-
184
-
185
-
186
-
187
-
188
-
189
-
190
-
191
-
192
-
193
-
194
-
195
-
196
-
197
-
198
-
199
-
200
-
201
-
202
-
203
-
204
-
205
-
206
-
207
-
208
-
209
-
210
-
211
-
212
-
 213
213 -
 214
214 -
 215
215 -
 216
216 -
 217
217 -
 218
218 -
 219
219 -
 220
220 -
 221
221 -
 222
222 -
 223
223 -
 224
224 -
 225
225 -
 226
226 -
 227
227 -
 228
228 -
 229
229 -
 230
230 -
 231
231 -
 232
232 -
 233
233 -
234
-
235
-
236
-
237
-
238
-
239
-
240
-
241
-
242
-
243
-
244
-
245
-
246
-
247
-
248
-
249
-
250
-
251
-
252
-
253
-
254
-
255
-
256
-
257
-
258
-
259
-
260
-
261
-
262
-
263
-
264
-
265
-
266
-
267
-
268
-
269
-
270
-
271
-
272
-
273
-
274
-
275
-
276
-
277
-
278
-
279
-
280
-
281
-
282
-
283
-
284
 |
 |

213
has a reimbursement agreement with the Residual holder under which the
Residual holder reimburses the Company for any payment made under
the liquidity arrangement. Through this reimbursement agreement, the
Residual holder remains economically exposed to fluctuations in value of
the municipal bond. These reimbursement agreements are actively margined
based on changes in value of the underlying municipal bond to mitigate the
Company’s counterparty credit risk. In cases where a third party provides
liquidity to a proprietary or QSPE TOB trust, a similar reimbursement
arrangement is made whereby the Company (or a consolidated subsidiary of
the Company) as Residual holder absorbs any losses incurred by the liquidity
provider. As of December 31, 2009, liquidity agreements provided with
respect to customer TOB trusts totaled $6.2 billion, offset by reimbursement
agreements in place with a notional amount of $4.6 billion. The remaining
exposure relates to TOB transactions where the Residual owned by the
customer is at least 25% of the bond value at the inception of the transaction.
In addition, the Company has provided liquidity arrangements with
a notional amount of $0.2 billion to QSPE TOB trusts and other non-
consolidated proprietary TOB trusts described above.
The Company considers the customer and proprietary TOB trusts
(excluding QSPE TOB trusts) to be VIEs. Because third-party investors hold
the Residual and Floater interests in the customer TOB trusts, the Company’s
involvement and variable interests include only its role as remarketing
agent and liquidity provider. On the basis of the variability absorbed by the
customer through the reimbursement arrangement or significant residual
investment, the Company does not consolidate the Customer TOB trusts.
The Company’s variable interests in the Proprietary TOB trusts include the
Residual as well as the remarketing and liquidity agreements with the trusts.
On the basis of the variability absorbed through these contracts (primarily
the Residual), the Company generally consolidates the Proprietary TOB
trusts. Finally, certain proprietary TOB trusts and QSPE TOB trusts are
not consolidated by application of specific accounting literature. For the
nonconsolidated proprietary TOB trusts and QSPE TOB trusts, the Company
recognizes only its residual investment on its balance sheet at fair value and
the third-party financing raised by the trusts is off balance sheet.
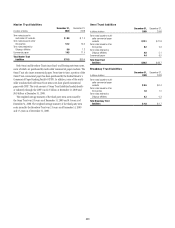
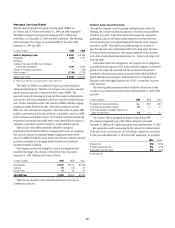
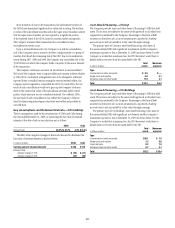
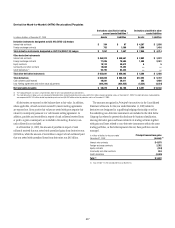
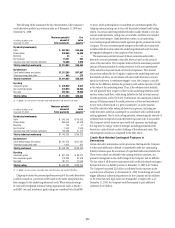
The following table summarizes selected cash flow information
related to Citicorp’s municipal bond securitizations for the years ended
December 31, 2009, 2008 and 2007:
In billions of dollars 2009 2008 2007
Proceeds from new securitizations $0.3 $1.2 $10.5
Cash flows received on retained
interests and other net cash flows 0.7 0.5 —
The following table summarizes selected cash flow information related to
Citi Holdings’ municipal bond securitizations for the years ended December
31, 2009, 2008 and 2007:
In billions of dollars 2009 2008 2007
Proceeds from new securitizations $— $0.1 $—
Cash flows received on retained
interests and other net cash flows — — —
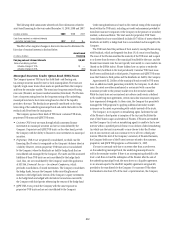
Municipal Investments
Municipal investment transactions represent partnerships that finance the
construction and rehabilitation of low-income affordable rental housing.
The Company generally invests in these partnerships as a limited partner and
earns a return primarily through the receipt of tax credits earned from the
affordable housing investments made by the partnership.
Client Intermediation
Client intermediation transactions represent a range of transactions
designed to provide investors with specified returns based on the returns of
an underlying security, referenced asset or index. These transactions include
credit-linked notes and equity-linked notes. In these transactions, the SPE
typically obtains exposure to the underlying security, referenced asset or
index through a derivative instrument, such as a total-return swap or a
credit-default swap. In turn the SPE issues notes to investors that pay a return
based on the specified underlying security, referenced asset or index. The SPE
invests the proceeds in a financial asset or a guaranteed insurance contract
(GIC) that serves as collateral for the derivative contract over the term of
the transaction. The Company’s involvement in these transactions includes
being the counterparty to the SPE’s derivative instruments and investing in a
portion of the notes issued by the SPE. In certain transactions, the investor’s
maximum risk of loss is limited and the Company absorbs risk of loss above
a specified level.
The Company’s maximum risk of loss in these transactions is defined as
the amount invested in notes issued by the SPE and the notional amount
of any risk of loss absorbed by the Company through a separate instrument
issued by the SPE. The derivative instrument held by the Company may
generate a receivable from the SPE (for example, where the Company
purchases credit protection from the SPE in connection with the SPE’s
issuance of a credit-linked note), which is collateralized by the assets
owned by the SPE. These derivative instruments are not considered variable
interests and any associated receivables are not included in the calculation of
maximum exposure to the SPE.