Citibank 2009 Annual Report Download - page 112
Download and view the complete annual report
Please find page 112 of the 2009 Citibank annual report below. You can navigate through the pages in the report by either clicking on the pages listed below, or by using the keyword search tool below to find specific information within the annual report.-
 1
1 -
2
-
3
-
4
-
5
-
6
-
7
-
8
-
9
-
10
-
11
-
12
-
13
-
14
-
15
-
16
-
17
-
18
-
19
-
20
-
21
-
22
-
23
-
24
-
25
-
26
-
27
-
28
-
29
-
30
-
31
-
32
-
33
-
34
-
35
-
36
-
37
-
38
-
39
-
40
-
41
-
42
-
43
-
44
-
45
-
46
-
47
-
48
-
49
-
50
-
51
-
52
-
53
-
54
-
55
-
56
-
57
-
58
-
59
-
60
-
61
-
62
-
63
-
64
-
65
-
66
-
67
-
68
-
69
-
70
-
71
-
72
-
73
-
74
-
75
-
76
-
77
-
78
-
79
-
80
-
81
-
82
-
83
-
84
-
85
-
86
-
87
-
88
-
89
-
90
-
91
-
92
-
93
-
94
-
95
-
96
-
97
-
98
-
99
-
100
-
101
-
 102
102 -
 103
103 -
 104
104 -
 105
105 -
 106
106 -
 107
107 -
 108
108 -
 109
109 -
 110
110 -
 111
111 -
 112
112 -
 113
113 -
 114
114 -
 115
115 -
 116
116 -
 117
117 -
 118
118 -
 119
119 -
 120
120 -
 121
121 -
 122
122 -
123
-
124
-
125
-
126
-
127
-
128
-
129
-
130
-
131
-
132
-
133
-
134
-
135
-
136
-
137
-
138
-
139
-
140
-
141
-
142
-
143
-
144
-
145
-
146
-
147
-
148
-
149
-
150
-
151
-
152
-
153
-
154
-
155
-
156
-
157
-
158
-
159
-
160
-
161
-
162
-
163
-
164
-
165
-
166
-
167
-
168
-
169
-
170
-
171
-
172
-
173
-
174
-
175
-
176
-
177
-
178
-
179
-
180
-
181
-
182
-
183
-
184
-
185
-
186
-
187
-
188
-
189
-
190
-
191
-
192
-
193
-
194
-
195
-
196
-
197
-
198
-
199
-
200
-
201
-
202
-
203
-
204
-
205
-
206
-
207
-
208
-
209
-
210
-
211
-
212
-
213
-
214
-
215
-
216
-
217
-
218
-
219
-
220
-
221
-
222
-
223
-
224
-
225
-
226
-
227
-
228
-
229
-
230
-
231
-
232
-
233
-
234
-
235
-
236
-
237
-
238
-
239
-
240
-
241
-
242
-
243
-
244
-
245
-
246
-
247
-
248
-
249
-
250
-
251
-
252
-
253
-
254
-
255
-
256
-
257
-
258
-
259
-
260
-
261
-
262
-
263
-
264
-
265
-
266
-
267
-
268
-
269
-
270
-
271
-
272
-
273
-
274
-
275
-
276
-
277
-
278
-
279
-
280
-
281
-
282
-
283
-
284
 |
 |

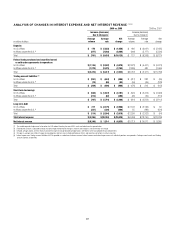
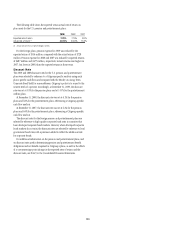
102
The following tables summarize the key characteristics of Citi’s credit derivative portfolio by counterparty and derivative form as of December 31, 2009 and
December 31, 2008:
2009 Fair values Notionals
In millions of dollars Receivable Payable Beneficiary Guarantor
By industry/counterparty
Bank $ 52,383 $ 50,778 $ 872,523 $ 807,484
Broker-dealer 23,241 22,932 338,829 340,949
Monoline 5,860 — 10,018 33
Non-financial 339 371 13,437 13,221
Insurance and other financial institutions 10,969 8,343 98,155 52,366
Total by industry/counterparty $ 92,792 $ 82,424 $1,332,962 $1,214,053
By instrument
Credit default swaps and options $ 91,625 $ 81,174 $1,305,724 $1,213,208
Total return swaps and other 1,167 1,250 27,238 845
Total by instrument $ 92,792 $ 82,424 $1,332,962 $1,214,053
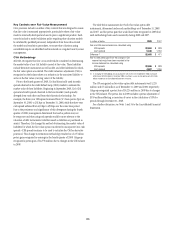
2008 Fair values Notionals
In millions of dollars Receivable Payable Beneficiary Guarantor
By industry/counterparty
Bank $ 128,042 $121,811 $ 996,248 $ 943,949
Broker-dealer 59,321 56,858 403,501 365,664
Monoline 6,886 91 9,973 139
Non-financial 4,874 2,561 5,608 7,540
Insurance and other financial institutions 29,228 22,388 180,354 125,988
Total by industry/counterparty $ 228,351 $203,709 $1,595,684 $1,443,280
By instrument
Credit default swaps and options $ 221,159 $203,220 $1,560,222 $1,441,375
Total return swaps and other 7,192 489 35,462 1,905
Total by instrument $ 228,351 $203,709 $1,595,684 $1,443,280
The fair values shown are prior to the application of any netting
agreements, cash collateral, and market or credit value adjustments.
Citigroup actively participates in trading a variety of credit derivatives
products as both an active two-way market-maker for clients and to manage
credit risk. The majority of this activity was transacted with other financial
intermediaries, including both banks and broker-dealers. Citigroup generally
has a mismatch between the total notional amounts of protection purchased
and sold and it may hold the reference assets directly, rather than entering
into offsetting credit derivative contracts as and when desired. The open risk
exposures from credit derivative contracts are largely matched after certain
cash positions in reference assets are considered and after notional amounts
are adjusted, either to a duration-based equivalent basis or to reflect the level
of subordination in tranched structures.
Citi actively monitors its counterparty credit risk in credit derivative
contracts. Approximately 85% and 88% of the gross receivables are from
counterparties with which Citi maintains collateral agreements as of
December 31, 2009 and 2008, respectively. A majority of Citi’s top 15
counterparties (by receivable balance owed to the company) are banks,
financial institutions or other dealers. Contracts with these counterparties
do not include ratings-based termination events. However, counterparty
rating downgrades may have an incremental effect by lowering the threshold
at which Citigroup may call for additional collateral. A number of the
remaining significant counterparties are monolines (which have CVA as
shown above).