Citibank 2009 Annual Report Download - page 171
Download and view the complete annual report
Please find page 171 of the 2009 Citibank annual report below. You can navigate through the pages in the report by either clicking on the pages listed below, or by using the keyword search tool below to find specific information within the annual report.-
 1
1 -
2
-
3
-
4
-
5
-
6
-
7
-
8
-
9
-
10
-
11
-
12
-
13
-
14
-
15
-
16
-
17
-
18
-
19
-
20
-
21
-
22
-
23
-
24
-
25
-
26
-
27
-
28
-
29
-
30
-
31
-
32
-
33
-
34
-
35
-
36
-
37
-
38
-
39
-
40
-
41
-
42
-
43
-
44
-
45
-
46
-
47
-
48
-
49
-
50
-
51
-
52
-
53
-
54
-
55
-
56
-
57
-
58
-
59
-
60
-
61
-
62
-
63
-
64
-
65
-
66
-
67
-
68
-
69
-
70
-
71
-
72
-
73
-
74
-
75
-
76
-
77
-
78
-
79
-
80
-
81
-
82
-
83
-
84
-
85
-
86
-
87
-
88
-
89
-
90
-
91
-
92
-
93
-
94
-
95
-
96
-
97
-
98
-
99
-
100
-
101
-
102
-
103
-
104
-
105
-
106
-
107
-
108
-
109
-
110
-
111
-
112
-
113
-
114
-
115
-
116
-
117
-
118
-
119
-
120
-
121
-
122
-
123
-
124
-
125
-
126
-
127
-
128
-
129
-
130
-
131
-
132
-
133
-
134
-
135
-
136
-
137
-
138
-
139
-
140
-
141
-
142
-
143
-
144
-
145
-
146
-
147
-
148
-
149
-
150
-
151
-
152
-
153
-
154
-
155
-
156
-
157
-
158
-
159
-
160
-
 161
161 -
 162
162 -
 163
163 -
 164
164 -
 165
165 -
 166
166 -
 167
167 -
 168
168 -
 169
169 -
 170
170 -
 171
171 -
 172
172 -
 173
173 -
 174
174 -
 175
175 -
 176
176 -
 177
177 -
 178
178 -
 179
179 -
 180
180 -
 181
181 -
182
-
183
-
184
-
185
-
186
-
187
-
188
-
189
-
190
-
191
-
192
-
193
-
194
-
195
-
196
-
197
-
198
-
199
-
200
-
201
-
202
-
203
-
204
-
205
-
206
-
207
-
208
-
209
-
210
-
211
-
212
-
213
-
214
-
215
-
216
-
217
-
218
-
219
-
220
-
221
-
222
-
223
-
224
-
225
-
226
-
227
-
228
-
229
-
230
-
231
-
232
-
233
-
234
-
235
-
236
-
237
-
238
-
239
-
240
-
241
-
242
-
243
-
244
-
245
-
246
-
247
-
248
-
249
-
250
-
251
-
252
-
253
-
254
-
255
-
256
-
257
-
258
-
259
-
260
-
261
-
262
-
263
-
264
-
265
-
266
-
267
-
268
-
269
-
270
-
271
-
272
-
273
-
274
-
275
-
276
-
277
-
278
-
279
-
280
-
281
-
282
-
283
-
284
 |
 |

161
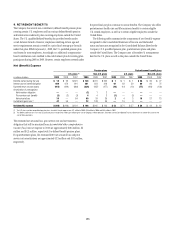
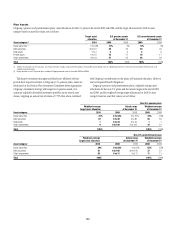
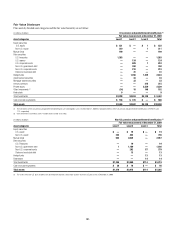
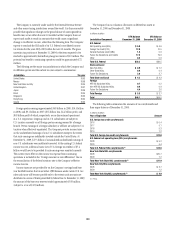
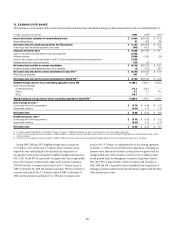
Fair Value Disclosure
Plan assets by detailed asset categories and the fair value hierarchy are as follows:
In millions of dollars U.S. pension and postretirement benefit plans (1)
Fair value measurement at December 31, 2009
Asset categories Level 1 Level 2 Level 3 Total
Equity securities
U.S. equity $ 531 $ — $ 1 $ 532
Non-U.S. equity 310 — 1 311
Mutual funds 199 — — 199
Debt securities
U.S. treasuries 1,263 — — 1,263
U.S. agency — 124 — 124
U.S. corporate bonds — 809 1 810
Non-U.S. government debt — 350 — 350
Non-U.S. corporate bonds — 218 — 218
State and municipal debt — 41 — 41
Hedge funds — 1,398 1,235 2,633
Asset backed securities — 33 — 33
Mortgage backed securities — 33 — 33
Annuity contracts — — 215 215
Private equity — — 2,539 2,539
Other investments (2) (14) 18 148 152
Real estate 9 — — 9
Total investments $2,298 $3,024 $4,140 $ 9,462
Cash and cash equivalents $ 108 $ 478 $ — $ 586
Total assets $2,406 $3,502 $4,140 $10,048
(1) The investments of the U.S. pension and postretirement benefit plans are commingled in a trust. At December 31, 2009, the allocable interests of the U.S. pension and postretirement benefit plans were 98.9% and
1.1%, respectively.
(2) Other investments classified as Level 1 include futures carried at fair value.
In millions of dollars Non-U.S. pension and postretirement benefit plans (1)
Fair value measurement at December 31, 2009
Asset categories Level 1 Level 2 Level 3 Total
Equity securities
U.S. equity $ — $ 19 $ — $ 19
Non-U.S. equity 323 422 — 745
Mutual funds 922 2,035 — 2,957
Debt securities
U.S. Treasuries — 19 — 19
Non-U.S. government debt 1 1,159 — 1,160
Non-U.S. corporate bonds — 292 87 379
State and municipal debt — 13 — 13
Hedge funds — — 13 13
Real estate — — 14 14
Total investments $1,246 $3,959 $114 $5,319
Cash and cash equivalents $ 30 $ 16 $ — $ 46
Total assets $1,276 $ 3,975 $114 $5,365
(1) The assets of the non-U.S. plans include assets of the top five countries, which make up 82% of all non-U.S. plan assets at December 31, 2009.