Citibank 2009 Annual Report Download - page 58
Download and view the complete annual report
Please find page 58 of the 2009 Citibank annual report below. You can navigate through the pages in the report by either clicking on the pages listed below, or by using the keyword search tool below to find specific information within the annual report.-
 1
1 -
2
-
3
-
4
-
5
-
6
-
7
-
8
-
9
-
10
-
11
-
12
-
13
-
14
-
15
-
16
-
17
-
18
-
19
-
20
-
21
-
22
-
23
-
24
-
25
-
26
-
27
-
28
-
29
-
30
-
31
-
32
-
33
-
34
-
35
-
36
-
37
-
38
-
39
-
40
-
41
-
42
-
43
-
44
-
45
-
46
-
47
-
 48
48 -
 49
49 -
 50
50 -
 51
51 -
 52
52 -
 53
53 -
 54
54 -
 55
55 -
 56
56 -
 57
57 -
 58
58 -
 59
59 -
 60
60 -
 61
61 -
 62
62 -
 63
63 -
 64
64 -
 65
65 -
 66
66 -
 67
67 -
 68
68 -
69
-
70
-
71
-
72
-
73
-
74
-
75
-
76
-
77
-
78
-
79
-
80
-
81
-
82
-
83
-
84
-
85
-
86
-
87
-
88
-
89
-
90
-
91
-
92
-
93
-
94
-
95
-
96
-
97
-
98
-
99
-
100
-
101
-
102
-
103
-
104
-
105
-
106
-
107
-
108
-
109
-
110
-
111
-
112
-
113
-
114
-
115
-
116
-
117
-
118
-
119
-
120
-
121
-
122
-
123
-
124
-
125
-
126
-
127
-
128
-
129
-
130
-
131
-
132
-
133
-
134
-
135
-
136
-
137
-
138
-
139
-
140
-
141
-
142
-
143
-
144
-
145
-
146
-
147
-
148
-
149
-
150
-
151
-
152
-
153
-
154
-
155
-
156
-
157
-
158
-
159
-
160
-
161
-
162
-
163
-
164
-
165
-
166
-
167
-
168
-
169
-
170
-
171
-
172
-
173
-
174
-
175
-
176
-
177
-
178
-
179
-
180
-
181
-
182
-
183
-
184
-
185
-
186
-
187
-
188
-
189
-
190
-
191
-
192
-
193
-
194
-
195
-
196
-
197
-
198
-
199
-
200
-
201
-
202
-
203
-
204
-
205
-
206
-
207
-
208
-
209
-
210
-
211
-
212
-
213
-
214
-
215
-
216
-
217
-
218
-
219
-
220
-
221
-
222
-
223
-
224
-
225
-
226
-
227
-
228
-
229
-
230
-
231
-
232
-
233
-
234
-
235
-
236
-
237
-
238
-
239
-
240
-
241
-
242
-
243
-
244
-
245
-
246
-
247
-
248
-
249
-
250
-
251
-
252
-
253
-
254
-
255
-
256
-
257
-
258
-
259
-
260
-
261
-
262
-
263
-
264
-
265
-
266
-
267
-
268
-
269
-
270
-
271
-
272
-
273
-
274
-
275
-
276
-
277
-
278
-
279
-
280
-
281
-
282
-
283
-
284
 |
 |

48
FUNDING AND LIQUIDITY
General
Citigroup’s cash flows and liquidity needs are primarily generated within
its operating subsidiaries. Exceptions exist for major corporate items,
such as the TARP repayment, and for equity and certain long-term debt
issuances, which take place at the Citigroup corporate level. Generally, Citi’s
management of funding and liquidity is designed to optimize availability
of funds as needed within Citi’s legal and regulatory structure. Various
constraints limit certain subsidiaries’ ability to pay dividends or otherwise
make funds available. Consistent with these constraints, Citigroup’s primary
objectives for funding and liquidity management are established by entity
and in aggregate across three main operating entities, as follows: (i)
Citigroup, as the parent holding company; (ii) banking subsidiaries; and
(iii) non-banking subsidiaries.
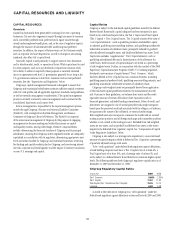
Citigroup sources of funding include deposits, collateralized financing
transactions and a variety of unsecured short- and long-term instruments,
including federal funds purchased, commercial paper, long-term debt, trust
preferred securities, preferred stock and common stock.
As a result of continued deleveraging, growth in deposits, term
securitization under government and non-government programs, the
issuance of long-term debt under the FDIC’s Temporary Liquidity Guarantee
Program (TLGP) and the issuance of non-guaranteed debt (particularly
during the latter part of 2009), Citigroup substantially increased its balances
of cash and highly liquid securities and reduced its short-term borrowings
during 2009.
Citi has focused on growing a geographically diverse retail and corporate
deposit base that stood at approximately $836 billion as of December 31,
2009, up $62 billion compared to December 31, 2008. On a volume basis,
deposit increases occurred in Regional Consumer Banking, particularly in
North America, and in Transaction Services due to growth in all regions
and strength in Treasury and Trade Solutions. Excluding the impact of
foreign exchange, Citi’s deposit base has increased sequentially over each of
the last six quarters. The deposits are diversified across products and regions,
with approximately 64% outside of the U.S. This diversification provides Citi
with an important and low-cost source of funding. A significant portion of
these deposits has been, and is currently expected to be, long-term and stable
and is considered to be core. During 2010, although our deposit balances
may be subject to seasonal fluctuations, we anticipate pursuing modest
deposit growth while concentrating on widening spreads.
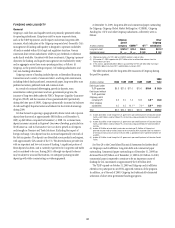
At December 31, 2009, long-term debt and commercial paper outstanding
for Citigroup, Citigroup Global Market Holdings Inc. (CGMHI), Citigroup
Funding Inc. (CFI) and other Citigroup subsidiaries, collectively, were as
follows:
In billions of dollars
Citigroup
parent
company CGMHI (1) CFI (1)
Other
Citigroup
subsidiaries
Long-term debt $197.8 (3) $13.4 $55.5 $97.3 (2)
Commercial paper $ — $ — $ 9.8 $ 0.4
(1) Citigroup guarantees all of CFI’s debt and CGMHI’s publicly issued securities.
(2) At December 31, 2009, approximately $24.1 billion relates to collateralized advances from the
Federal Home Loan Bank.
(3) Of this amount, approximately $64.6 billion is guaranteed by the FDIC with $6.3 billion maturing in
2010, $20.3 billion maturing in 2011 and $38 billion maturing in 2012.
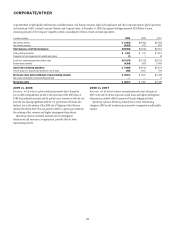
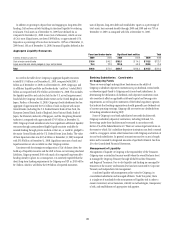
The table below details the long-term debt issuances of Citigroup during
the past five quarters.
In billions of dollars 4Q08 1Q09 2Q09 3Q09 4Q09
2009
Total
Debt issued under
TLGP guarantee $5.8 $ 21.9 $17.0 $10.0 $10.0 $ 58.9
Debt issued without
TLGP guarantee:
Citigroup parent
company/CFI 0.3 2.0 7.4 12.6 4.0 (3)
26.0
Other Citigroup
subsidiaries 0.5 0.5 10.1 (1) 7.9 (2) 5.8 (4) 24.3
Total $6.6 $24.4 $34.5 $30.5 $19.8 $ 109.2
(1) Includes $8.5 billion issued through the U.S. government-sponsored Department of Education Conduit
Facility, and $1 billion issued by Citibank Pty. Ltd. Australia and guaranteed by the Commonwealth of
Australia.
(2) Includes $3.3 billion issued through the U.S. government-sponsored Department of Education Conduit
Facility, and $1 billion issued by Citibank Pty. Ltd. Australia and guaranteed by the Commonwealth of
Australia.
(3) Includes $1.9 billion of senior debt issued under remarketing of $1.9 billion of Citigroup trust
preferred securities held by the Abu Dhabi Investment Authority (ADIA) to provide funds for settlement
of the forward stock purchase contract in March 2010, as provided for by the agreement between Citi
and ADIA.
(4) Includes $1.4 billion issued through the U.S. government-sponsored Department of Education Conduit
Facility.
See Note 20 to the Consolidated Financial Statements for further detail
on Citigroup’s and its affiliates’ long-term debt and commercial paper
outstanding. Commercial paper outstanding as of December 31, 2009 has
decreased from $29 billion as of December 31, 2008 to $10 billion. In 2010,
commercial paper is expected to continue to be an important source of
funding for Citi, maintained at approximately the $10 billion level.
The TLGP expired on October 31, 2009 and Citigroup and its affiliates
elected not to participate in any FDIC-approved extension of the program.
In addition, as of the end of 2009, Citigroup had substantially eliminated
utilization of short-term government funding programs.