Citibank 2009 Annual Report Download - page 218
Download and view the complete annual report
Please find page 218 of the 2009 Citibank annual report below. You can navigate through the pages in the report by either clicking on the pages listed below, or by using the keyword search tool below to find specific information within the annual report.-
 1
1 -
2
-
3
-
4
-
5
-
6
-
7
-
8
-
9
-
10
-
11
-
12
-
13
-
14
-
15
-
16
-
17
-
18
-
19
-
20
-
21
-
22
-
23
-
24
-
25
-
26
-
27
-
28
-
29
-
30
-
31
-
32
-
33
-
34
-
35
-
36
-
37
-
38
-
39
-
40
-
41
-
42
-
43
-
44
-
45
-
46
-
47
-
48
-
49
-
50
-
51
-
52
-
53
-
54
-
55
-
56
-
57
-
58
-
59
-
60
-
61
-
62
-
63
-
64
-
65
-
66
-
67
-
68
-
69
-
70
-
71
-
72
-
73
-
74
-
75
-
76
-
77
-
78
-
79
-
80
-
81
-
82
-
83
-
84
-
85
-
86
-
87
-
88
-
89
-
90
-
91
-
92
-
93
-
94
-
95
-
96
-
97
-
98
-
99
-
100
-
101
-
102
-
103
-
104
-
105
-
106
-
107
-
108
-
109
-
110
-
111
-
112
-
113
-
114
-
115
-
116
-
117
-
118
-
119
-
120
-
121
-
122
-
123
-
124
-
125
-
126
-
127
-
128
-
129
-
130
-
131
-
132
-
133
-
134
-
135
-
136
-
137
-
138
-
139
-
140
-
141
-
142
-
143
-
144
-
145
-
146
-
147
-
148
-
149
-
150
-
151
-
152
-
153
-
154
-
155
-
156
-
157
-
158
-
159
-
160
-
161
-
162
-
163
-
164
-
165
-
166
-
167
-
168
-
169
-
170
-
171
-
172
-
173
-
174
-
175
-
176
-
177
-
178
-
179
-
180
-
181
-
182
-
183
-
184
-
185
-
186
-
187
-
188
-
189
-
190
-
191
-
192
-
193
-
194
-
195
-
196
-
197
-
198
-
199
-
200
-
201
-
202
-
203
-
204
-
205
-
206
-
207
-
 208
208 -
 209
209 -
 210
210 -
 211
211 -
 212
212 -
 213
213 -
 214
214 -
 215
215 -
 216
216 -
 217
217 -
 218
218 -
 219
219 -
 220
220 -
 221
221 -
 222
222 -
 223
223 -
 224
224 -
 225
225 -
 226
226 -
 227
227 -
 228
228 -
229
-
230
-
231
-
232
-
233
-
234
-
235
-
236
-
237
-
238
-
239
-
240
-
241
-
242
-
243
-
244
-
245
-
246
-
247
-
248
-
249
-
250
-
251
-
252
-
253
-
254
-
255
-
256
-
257
-
258
-
259
-
260
-
261
-
262
-
263
-
264
-
265
-
266
-
267
-
268
-
269
-
270
-
271
-
272
-
273
-
274
-
275
-
276
-
277
-
278
-
279
-
280
-
281
-
282
-
283
-
284
 |
 |

208
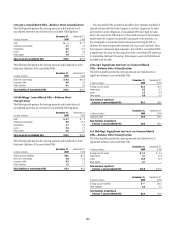
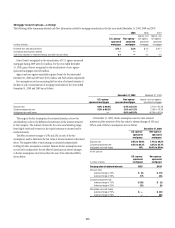
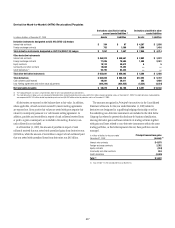
At December 31, 2009, the key assumptions used to value retained
interests and the sensitivity of the fair value to adverse changes of 10% and
20% in each of the key assumptions were as follows:
Retained interests
Discount rate 5.4% to 16.9%
Constant prepayment rate 0.2% to 4.4%
Anticipated net credit losses 0.3% to 0.9%
Weighted average life 4.2 to 10.3 years
In millions of dollars Retained interests
Carrying value of retained interests $997
Discount rates
Adverse change of 10% $ (29)
Adverse change of 20% (57)
Constant prepayment rate
Adverse change of 10% $ (4)
Adverse change of 20% (8)
Anticipated net credit losses
Adverse change of 10% $ (5)
Adverse change of 20% (10)
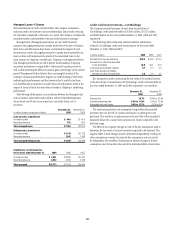
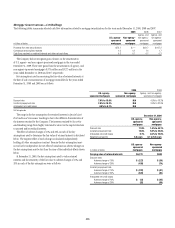
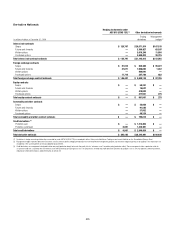
On-Balance-Sheet Securitizations—Citi Holdings
The Company engages in on-balance-sheet securitizations. These are
securitizations that do not qualify for sales treatment; thus, the assets remain
on the Company’s balance sheet. The following table presents the carrying
amounts and classification of consolidated assets and liabilities transferred
in transactions from the Consumer credit card, student loan, mortgage and
auto businesses, accounted for as secured borrowings:
In billions of dollars
December 31,
2009
December 31,
2008
Cash $ 0.7 $ 0.3
Available-for-sale securities 0.1 0.1
Loans 24.8 7.5
Allowance for loan losses (0.2) (0.1)
Other 0.8 —
Total assets $26.2 $ 7.8
Long-term debt $20.9 $ 6.3
Other liabilities 2.1 0.3
Total liabilities $23.0 $ 6.6
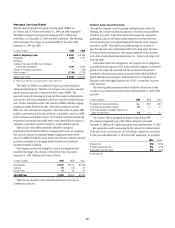
All assets are restricted from being sold or pledged as collateral. The cash
flows from these assets are the only source used to pay down the associated
liabilities, which are non-recourse to the Company’s general assets.
Citi-Administered Asset-Backed Commercial Paper Conduits
The Company is active in the asset-backed commercial paper conduit
business as administrator of several multi-seller commercial paper conduits,
and also as a service provider to single-seller and other commercial paper
conduits sponsored by third parties.
The multi-seller commercial paper conduits are designed to provide the
Company’s customers access to low-cost funding in the commercial paper
markets. The conduits purchase assets from or provide financing facilities
to customers and are funded by issuing commercial paper to third-party
investors. The conduits generally do not purchase assets originated by the
Company. The funding of the conduit is facilitated by the liquidity support
and credit enhancements provided by the Company.
As administrator to the conduits, the Company is responsible for selecting
and structuring assets purchased or financed by the conduits, making
decisions regarding the funding of the conduits, including determining
the tenor and other features of the commercial paper issued, monitoring
the quality and performance of the conduits’ assets, and facilitating the
operations and cash flows of the conduits. In return, the Company earns
structuring fees from customers for individual transactions and earns an
administration fee from the conduit, which is equal to the income from
client program and liquidity fees of the conduit after payment of interest
costs and other fees. This administration fee is fairly stable, since most risks
and rewards of the underlying assets are passed back to the customers and,
once the asset pricing is negotiated, most ongoing income, costs and fees are
relatively stable as a percentage of the conduit’s size.
The conduits administered by the Company do not generally invest
in liquid securities that are formally rated by third parties. The assets are
privately negotiated and structured transactions that are designed to be
held by the conduit, rather than actively traded and sold. The yield earned
by the conduit on each asset is generally tied to the rate on the commercial
paper issued by the conduit, thus passing interest rate risk to the client.
Each asset purchased by the conduit is structured with transaction-specific
credit enhancement features provided by the third-party seller, including
over collateralization, cash and excess spread collateral accounts, direct
recourse or third-party guarantees. These credit enhancements are sized with
the objective of approximating a credit rating of A or above, based on the
Company’s internal risk ratings.
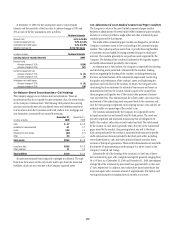
Substantially all of the funding of the conduits is in the form of short-
term commercial paper, with a weighted average life generally ranging from
30 to 45 days. As of December 31, 2009 and December 31, 2008, the weighted
average life of the commercial paper issued was approximately 43 days and
37 days, respectively. In addition, the conduits have issued subordinate loss
notes and equity with a notional amount of approximately $76 million and
varying remaining tenors ranging from six months to six years.