Citibank 2009 Annual Report Download - page 81
Download and view the complete annual report
Please find page 81 of the 2009 Citibank annual report below. You can navigate through the pages in the report by either clicking on the pages listed below, or by using the keyword search tool below to find specific information within the annual report.-
 1
1 -
2
-
3
-
4
-
5
-
6
-
7
-
8
-
9
-
10
-
11
-
12
-
13
-
14
-
15
-
16
-
17
-
18
-
19
-
20
-
21
-
22
-
23
-
24
-
25
-
26
-
27
-
28
-
29
-
30
-
31
-
32
-
33
-
34
-
35
-
36
-
37
-
38
-
39
-
40
-
41
-
42
-
43
-
44
-
45
-
46
-
47
-
48
-
49
-
50
-
51
-
52
-
53
-
54
-
55
-
56
-
57
-
58
-
59
-
60
-
61
-
62
-
63
-
64
-
65
-
66
-
67
-
68
-
69
-
70
-
 71
71 -
 72
72 -
 73
73 -
 74
74 -
 75
75 -
 76
76 -
 77
77 -
 78
78 -
 79
79 -
 80
80 -
 81
81 -
 82
82 -
 83
83 -
 84
84 -
 85
85 -
 86
86 -
 87
87 -
 88
88 -
 89
89 -
 90
90 -
 91
91 -
92
-
93
-
94
-
95
-
96
-
97
-
98
-
99
-
100
-
101
-
102
-
103
-
104
-
105
-
106
-
107
-
108
-
109
-
110
-
111
-
112
-
113
-
114
-
115
-
116
-
117
-
118
-
119
-
120
-
121
-
122
-
123
-
124
-
125
-
126
-
127
-
128
-
129
-
130
-
131
-
132
-
133
-
134
-
135
-
136
-
137
-
138
-
139
-
140
-
141
-
142
-
143
-
144
-
145
-
146
-
147
-
148
-
149
-
150
-
151
-
152
-
153
-
154
-
155
-
156
-
157
-
158
-
159
-
160
-
161
-
162
-
163
-
164
-
165
-
166
-
167
-
168
-
169
-
170
-
171
-
172
-
173
-
174
-
175
-
176
-
177
-
178
-
179
-
180
-
181
-
182
-
183
-
184
-
185
-
186
-
187
-
188
-
189
-
190
-
191
-
192
-
193
-
194
-
195
-
196
-
197
-
198
-
199
-
200
-
201
-
202
-
203
-
204
-
205
-
206
-
207
-
208
-
209
-
210
-
211
-
212
-
213
-
214
-
215
-
216
-
217
-
218
-
219
-
220
-
221
-
222
-
223
-
224
-
225
-
226
-
227
-
228
-
229
-
230
-
231
-
232
-
233
-
234
-
235
-
236
-
237
-
238
-
239
-
240
-
241
-
242
-
243
-
244
-
245
-
246
-
247
-
248
-
249
-
250
-
251
-
252
-
253
-
254
-
255
-
256
-
257
-
258
-
259
-
260
-
261
-
262
-
263
-
264
-
265
-
266
-
267
-
268
-
269
-
270
-
271
-
272
-
273
-
274
-
275
-
276
-
277
-
278
-
279
-
280
-
281
-
282
-
283
-
284
 |
 |

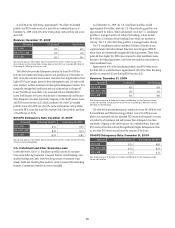
71
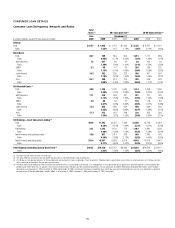
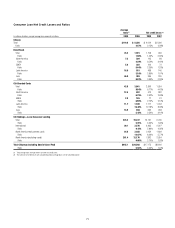
Consumer Loan Net Credit Losses and Ratios
Average
loans(1) Net credit losses (2)
In millions of dollars, except average loan amounts in billions 2009 2009 2008 2007
Citicorp
Total $119.8 $ 5,356 $ 4,024 $2,390
Ratio 4.47% 3.15% 2.08%
Retail Bank
Total 76.3 1,515 1,158 466
Ratio 1.98% 1.43% 0.65%
North America 7.2 309 145 68
Ratio 4.29% 3.54% 3.40%
EMEA 5.6 302 160 72
Ratio 5.44% 2.39% 1.33%
Latin America 16.6 515 488 146
Ratio 3.10% 2.89% 1.07%
Asia 46.9 389 365 180
Ratio 0.83% 0.69% 0.36%
Citi-Branded Cards
Total 43.5 3,841 2,866 1,924
Ratio 8.84% 6.11% 4.43%
North America 12.5 842 470 382
Ratio 6.75% 3.62% 2.58%
EMEA 2.8 185 77 41
Ratio 6.55% 2.75% 2.16%
Latin America 11.7 1,920 1,717 1,043
Ratio 16.48% 12.18% 8.48%
Asia 16.5 894 602 458
Ratio 5.42% 3.54% 3.16%
Citi Holdings—Local Consumer Lending
Total 325.3 19,237 13,151 6,790
Ratio 5.91% 3.56% 1.90%
International 39.1 3,576 2,835 2,227
Ratio 9.15% 5.86% 4.95%
North America retail partners cards 24.8 3,485 2,454 1,639
Ratio 14.07% 8.26% 5.77%
North America (excluding cards) 261.4 12,176 7,862 2,924
Ratio 4.66% 2.70% 1.03%
Total Citigroup (excluding Special Asset Pool) $445.1 $24,593 $17,175 $9,180
Ratio 5.53% 3.45% 1.94%
(1) Total average loans exclude interest and fees on credit cards.
(2) The ratios of net credit losses are calculated based on average loans, net of unearned income.