Citibank 2009 Annual Report Download - page 114
Download and view the complete annual report
Please find page 114 of the 2009 Citibank annual report below. You can navigate through the pages in the report by either clicking on the pages listed below, or by using the keyword search tool below to find specific information within the annual report.-
 1
1 -
2
-
3
-
4
-
5
-
6
-
7
-
8
-
9
-
10
-
11
-
12
-
13
-
14
-
15
-
16
-
17
-
18
-
19
-
20
-
21
-
22
-
23
-
24
-
25
-
26
-
27
-
28
-
29
-
30
-
31
-
32
-
33
-
34
-
35
-
36
-
37
-
38
-
39
-
40
-
41
-
42
-
43
-
44
-
45
-
46
-
47
-
48
-
49
-
50
-
51
-
52
-
53
-
54
-
55
-
56
-
57
-
58
-
59
-
60
-
61
-
62
-
63
-
64
-
65
-
66
-
67
-
68
-
69
-
70
-
71
-
72
-
73
-
74
-
75
-
76
-
77
-
78
-
79
-
80
-
81
-
82
-
83
-
84
-
85
-
86
-
87
-
88
-
89
-
90
-
91
-
92
-
93
-
94
-
95
-
96
-
97
-
98
-
99
-
100
-
101
-
102
-
103
-
 104
104 -
 105
105 -
 106
106 -
 107
107 -
 108
108 -
 109
109 -
 110
110 -
 111
111 -
 112
112 -
 113
113 -
 114
114 -
 115
115 -
 116
116 -
 117
117 -
 118
118 -
 119
119 -
 120
120 -
 121
121 -
 122
122 -
 123
123 -
 124
124 -
125
-
126
-
127
-
128
-
129
-
130
-
131
-
132
-
133
-
134
-
135
-
136
-
137
-
138
-
139
-
140
-
141
-
142
-
143
-
144
-
145
-
146
-
147
-
148
-
149
-
150
-
151
-
152
-
153
-
154
-
155
-
156
-
157
-
158
-
159
-
160
-
161
-
162
-
163
-
164
-
165
-
166
-
167
-
168
-
169
-
170
-
171
-
172
-
173
-
174
-
175
-
176
-
177
-
178
-
179
-
180
-
181
-
182
-
183
-
184
-
185
-
186
-
187
-
188
-
189
-
190
-
191
-
192
-
193
-
194
-
195
-
196
-
197
-
198
-
199
-
200
-
201
-
202
-
203
-
204
-
205
-
206
-
207
-
208
-
209
-
210
-
211
-
212
-
213
-
214
-
215
-
216
-
217
-
218
-
219
-
220
-
221
-
222
-
223
-
224
-
225
-
226
-
227
-
228
-
229
-
230
-
231
-
232
-
233
-
234
-
235
-
236
-
237
-
238
-
239
-
240
-
241
-
242
-
243
-
244
-
245
-
246
-
247
-
248
-
249
-
250
-
251
-
252
-
253
-
254
-
255
-
256
-
257
-
258
-
259
-
260
-
261
-
262
-
263
-
264
-
265
-
266
-
267
-
268
-
269
-
270
-
271
-
272
-
273
-
274
-
275
-
276
-
277
-
278
-
279
-
280
-
281
-
282
-
283
-
284
 |
 |

104
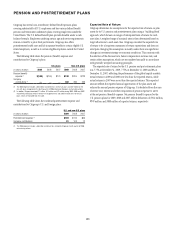
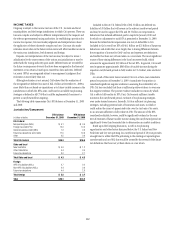
The following table shows the expected versus actual rate of return on
plan assets for the U.S. pension and postretirement plans:
2009 2008 2007
Expected rate of return 7.75% 7.75% 8.0%
Actual rate of return (1) (2.77)% (5.42)% 13.2%
(1) Actual rates of return are presented gross of fees.
For the foreign plans, pension expense for 2009 was reduced by the
expected return of $336 million, compared with the actual return of $728
million. Pension expense for 2008 and 2007 was reduced by expected returns
of $487 million and $477 million, respectively. Actual returns were higher in
2007, but lower in 2008, than the expected returns in those years.
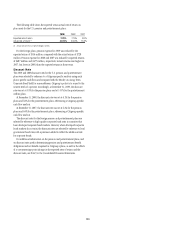
Discount Rate
The 2009 and 2008 discount rates for the U.S. pension and postretirement
plans were selected by reference to a Citigroup-specific analysis using each
plan’s specific cash flows and compared with the Moody’s Aa Long-Term
Corporate Bond Yield for reasonableness. Citigroup’s policy is to round to the
nearest tenth of a percent. Accordingly, at December 31, 2009, the discount
rate was set at 5.9% for the pension plans and at 5.55% for the postretirement
welfare plans.
At December 31, 2008, the discount rate was set at 6.1% for the pension
plans and 6.0% for the postretirement plans, referencing a Citigroup-specific
cash flow analysis.
At December 31, 2007, the discount rate was set at 6.2% for the pension
plans and 6.0% for the postretirement plans, referencing a Citigroup-specific
cash flow analysis.
The discount rates for the foreign pension and postretirement plans are
selected by reference to high-quality corporate bond rates in countries that
have developed corporate bond markets. However, where developed corporate
bond markets do not exist, the discount rates are selected by reference to local
government bond rates with a premium added to reflect the additional risk
for corporate bonds.
For additional information on the pension and postretirement plans, and
on discount rates used in determining pension and postretirement benefit
obligations and net benefit expense for Citigroup’s plans, as well as the effects
of a one-percentage-point change in the expected rates of return and the
discount rates, see Note 9 to the Consolidated Financial Statements.