Citibank 2009 Annual Report Download - page 184
Download and view the complete annual report
Please find page 184 of the 2009 Citibank annual report below. You can navigate through the pages in the report by either clicking on the pages listed below, or by using the keyword search tool below to find specific information within the annual report.-
 1
1 -
2
-
3
-
4
-
5
-
6
-
7
-
8
-
9
-
10
-
11
-
12
-
13
-
14
-
15
-
16
-
17
-
18
-
19
-
20
-
21
-
22
-
23
-
24
-
25
-
26
-
27
-
28
-
29
-
30
-
31
-
32
-
33
-
34
-
35
-
36
-
37
-
38
-
39
-
40
-
41
-
42
-
43
-
44
-
45
-
46
-
47
-
48
-
49
-
50
-
51
-
52
-
53
-
54
-
55
-
56
-
57
-
58
-
59
-
60
-
61
-
62
-
63
-
64
-
65
-
66
-
67
-
68
-
69
-
70
-
71
-
72
-
73
-
74
-
75
-
76
-
77
-
78
-
79
-
80
-
81
-
82
-
83
-
84
-
85
-
86
-
87
-
88
-
89
-
90
-
91
-
92
-
93
-
94
-
95
-
96
-
97
-
98
-
99
-
100
-
101
-
102
-
103
-
104
-
105
-
106
-
107
-
108
-
109
-
110
-
111
-
112
-
113
-
114
-
115
-
116
-
117
-
118
-
119
-
120
-
121
-
122
-
123
-
124
-
125
-
126
-
127
-
128
-
129
-
130
-
131
-
132
-
133
-
134
-
135
-
136
-
137
-
138
-
139
-
140
-
141
-
142
-
143
-
144
-
145
-
146
-
147
-
148
-
149
-
150
-
151
-
152
-
153
-
154
-
155
-
156
-
157
-
158
-
159
-
160
-
161
-
162
-
163
-
164
-
165
-
166
-
167
-
168
-
169
-
170
-
171
-
172
-
173
-
 174
174 -
 175
175 -
 176
176 -
 177
177 -
 178
178 -
 179
179 -
 180
180 -
 181
181 -
 182
182 -
 183
183 -
 184
184 -
 185
185 -
 186
186 -
 187
187 -
 188
188 -
 189
189 -
 190
190 -
 191
191 -
 192
192 -
 193
193 -
 194
194 -
195
-
196
-
197
-
198
-
199
-
200
-
201
-
202
-
203
-
204
-
205
-
206
-
207
-
208
-
209
-
210
-
211
-
212
-
213
-
214
-
215
-
216
-
217
-
218
-
219
-
220
-
221
-
222
-
223
-
224
-
225
-
226
-
227
-
228
-
229
-
230
-
231
-
232
-
233
-
234
-
235
-
236
-
237
-
238
-
239
-
240
-
241
-
242
-
243
-
244
-
245
-
246
-
247
-
248
-
249
-
250
-
251
-
252
-
253
-
254
-
255
-
256
-
257
-
258
-
259
-
260
-
261
-
262
-
263
-
264
-
265
-
266
-
267
-
268
-
269
-
270
-
271
-
272
-
273
-
274
-
275
-
276
-
277
-
278
-
279
-
280
-
281
-
282
-
283
-
284
 |
 |

174
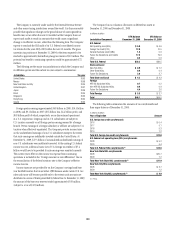
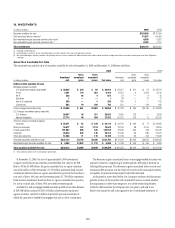
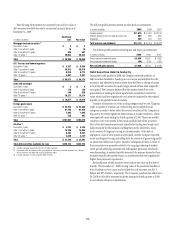
16. INVESTMENTS
In millions of dollars 2009 2008
Securities available-for-sale $239,599 $175,189
Debt securities held-to-maturity (1) 51,527 64,459
Non-marketable equity securities carried at fair value (2) 6,830 9,262
Non-marketable equity securities carried at cost (3) 8,163 7,110
Total investments $306,119 $256,020
(1) Recorded at amortized cost.
(2) Unrealized gains and losses for non-marketable equity securities carried at fair value are recognized in earnings.
(3) Non-marketable equity securities carried at cost primarily consist of shares issued by the Federal Reserve Bank, Federal Home Loan Bank, foreign central banks and various clearing houses of which Citigroup is
a member.
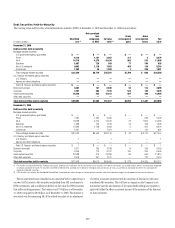
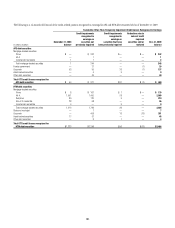
Securities Available-for-Sale
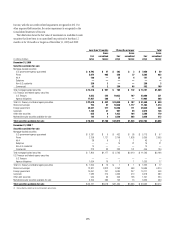
The amortized cost and fair value of securities available-for-sale at December 31, 2009 and December 31, 2008 were as follows:
2009 2008 (1)
In millions of dollars
Amortized
cost
Gross
unrealized
gains
Gross
unrealized
losses Fair value
Amortized
cost
Gross
unrealized
gains
Gross
unrealized
losses Fair value
Debt securities available-for-sale
Mortgage-backed securities
U.S. government-agency guaranteed $ 20,625 $ 339 $ 50 $ 20,914 $ 23,527 $ 261 $ 67 $ 23,721
Prime 7,291 119 932 6,478 8,475 3 2,965 5,513
Alt-A 538 93 4 627 54 — 9 45
Subprime 1 — — 1 38 — 21 17
Non-U.S. residential 258 — 3 255 185 2 — 187
Commercial 883 10 100 793 519 — 134 385
Total mortgage-backed securities $ 29,596 $ 561 $1,089 $ 29,068 $ 32,798 $ 266 $ 3,196 $ 29,868
U.S. Treasury and federal agency securities
U.S. Treasury 26,857 36 331 26,562 3,465 125 — 3,590
Agency obligations 27,714 46 208 27,552 20,237 215 77 20,375
Total U.S. Treasury and federal agency
securities $ 54,571 $ 82 $ 539 $ 54,114 $ 23,702 $ 340 $ 77 $ 23,965
State and municipal 16,677 147 1,214 15,610 18,156 38 4,370 13,824
Foreign government 101,987 860 328 102,519 79,505 945 408 80,042
Corporate 20,024 435 146 20,313 10,646 65 680 10,031
Other debt securities 12,268 71 170 12,169 11,784 36 224 11,596
Total debt securities available-for-sale $235,123 $2,156 $3,486 $233,793 $176,591 $1,690 $ 8,955 $169,326
Marketable equity securities available-for-sale $ 4,089 $1,929 $ 212 $ 5,806 $ 5,768 $ 554 $ 459 $ 5,863
Total securities available-for-sale $239,212 $4,085 $3,698 $239,599 $182,359 $2,244 $ 9,414 $175,189
(1) Reclassified to conform to the current period’s presentation.
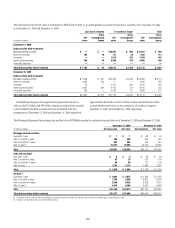
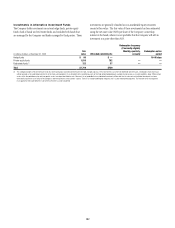
At December 31, 2009, the cost of approximately 5,000 investments
in equity and fixed-income securities exceeded their fair value by $3.698
billion. Of the $3.698 billion, the gross unrealized loss on equity securities
was $212 million. Of the remainder, $1.756 billion represents fixed-income
investments that have been in a gross-unrealized-loss position for less than a
year and, of these, 44% are rated investment grade; $1.730 billion represents
fixed-income investments that have been in a gross-unrealized-loss position
for a year or more and, of these, 96% are rated investment grade.
Available-for-sale mortgage-backed securities-portfolio fair value balance
of $29.068 billion consists of $20.914 billion of government-sponsored
agency securities, and $8.154 billion of privately sponsored securities of
which the majority is backed by mortgages that are not Alt-A or subprime.
The decrease in gross unrealized losses on mortgage-backed securities was
primarily related to a tightening of market spreads, reflecting a decrease in
risk/liquidity premiums. The decrease in gross unrealized losses on state and
municipal debt securities was the result of recovery in the municipal markets,
as liquidity increased and municipal bond yields decreased.
As discussed in more detail below, the Company conducts and documents
periodic reviews of all securities with unrealized losses to evaluate whether
the impairment is other than temporary. Any credit-related impairment
related to debt securities the Company does not plan to sell and is not
likely to be required to sell is recognized in the Consolidated Statement of