Citibank 2009 Annual Report Download - page 132
Download and view the complete annual report
Please find page 132 of the 2009 Citibank annual report below. You can navigate through the pages in the report by either clicking on the pages listed below, or by using the keyword search tool below to find specific information within the annual report.-
 1
1 -
2
-
3
-
4
-
5
-
6
-
7
-
8
-
9
-
10
-
11
-
12
-
13
-
14
-
15
-
16
-
17
-
18
-
19
-
20
-
21
-
22
-
23
-
24
-
25
-
26
-
27
-
28
-
29
-
30
-
31
-
32
-
33
-
34
-
35
-
36
-
37
-
38
-
39
-
40
-
41
-
42
-
43
-
44
-
45
-
46
-
47
-
48
-
49
-
50
-
51
-
52
-
53
-
54
-
55
-
56
-
57
-
58
-
59
-
60
-
61
-
62
-
63
-
64
-
65
-
66
-
67
-
68
-
69
-
70
-
71
-
72
-
73
-
74
-
75
-
76
-
77
-
78
-
79
-
80
-
81
-
82
-
83
-
84
-
85
-
86
-
87
-
88
-
89
-
90
-
91
-
92
-
93
-
94
-
95
-
96
-
97
-
98
-
99
-
100
-
101
-
102
-
103
-
104
-
105
-
106
-
107
-
108
-
109
-
110
-
111
-
112
-
113
-
114
-
115
-
116
-
117
-
118
-
119
-
120
-
121
-
 122
122 -
 123
123 -
 124
124 -
 125
125 -
 126
126 -
 127
127 -
 128
128 -
 129
129 -
 130
130 -
 131
131 -
 132
132 -
 133
133 -
 134
134 -
 135
135 -
 136
136 -
 137
137 -
 138
138 -
 139
139 -
 140
140 -
 141
141 -
 142
142 -
143
-
144
-
145
-
146
-
147
-
148
-
149
-
150
-
151
-
152
-
153
-
154
-
155
-
156
-
157
-
158
-
159
-
160
-
161
-
162
-
163
-
164
-
165
-
166
-
167
-
168
-
169
-
170
-
171
-
172
-
173
-
174
-
175
-
176
-
177
-
178
-
179
-
180
-
181
-
182
-
183
-
184
-
185
-
186
-
187
-
188
-
189
-
190
-
191
-
192
-
193
-
194
-
195
-
196
-
197
-
198
-
199
-
200
-
201
-
202
-
203
-
204
-
205
-
206
-
207
-
208
-
209
-
210
-
211
-
212
-
213
-
214
-
215
-
216
-
217
-
218
-
219
-
220
-
221
-
222
-
223
-
224
-
225
-
226
-
227
-
228
-
229
-
230
-
231
-
232
-
233
-
234
-
235
-
236
-
237
-
238
-
239
-
240
-
241
-
242
-
243
-
244
-
245
-
246
-
247
-
248
-
249
-
250
-
251
-
252
-
253
-
254
-
255
-
256
-
257
-
258
-
259
-
260
-
261
-
262
-
263
-
264
-
265
-
266
-
267
-
268
-
269
-
270
-
271
-
272
-
273
-
274
-
275
-
276
-
277
-
278
-
279
-
280
-
281
-
282
-
283
-
284
 |
 |

122
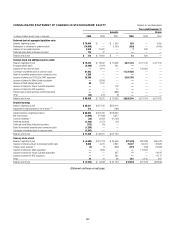
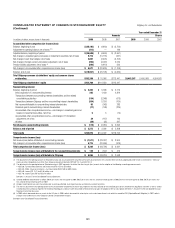
CONSOLIDATED STATEMENT OF CHANGES IN STOCKHOLDERS’ EQUITY Citigroup Inc. and Subsidiaries
Year ended December 31
Amounts Shares
In millions of dollars, except shares in thousands 2009 2008 2007 2009 2008 2007
Preferred stock at aggregate liquidation value
Balance, beginning of year $ 70,664 $ — $ 1,000 829 — 4,000
Redemption or retirement of preferred stock (74,005) — (1,000) (824) — (4,000)
Issuance of new preferred stock 3,530 70,627 — 7829 —
Preferred stock Series H discount accretion 123 37 — —— —
Balance, end of year $ 312 $ 70,664 $ — 12 829 —
Common stock and additional paid-in capital
Balance, beginning of year $ 19,222 $ 18,062 $ 18,308 5,671,744 5,477,416 5,477,416
Employee benefit plans (4,395) (1,921) 455 —— —
Issuance of new common stock —4,911 — —194,328 —
Conversion of preferred stock to common stock 61,963 — — 17,372,588 — —
Reset of convertible preferred stock conversion price 1,285 — — —— —
Issuance of shares and T-DECs for TARP repayment 20,298 — — 5,581,768 — —
Issuance of shares for Nikko Cordial acquisition —(3,500) — —— —
Issuance of TARP-related warrants 88 1,797 — —— —
Issuance of shares for Grupo Cuscatlán acquisition —— 118 —— —
Issuance of shares for ATD acquisition —— 74 —— —
Present value of stock purchase contract payments —— (888) —— —
Other (33) (127) (5) —— —
Balance, end of year $ 98,428 $ 19,222 $ 18,062 28,626,100 5,671,744 5,477,416
Retained earnings
Balance, beginning of year $ 86,521 $121,769 $129,116
Adjustment to opening balance, net of taxes (1) (2) 413 — (186)
Adjusted balance, beginning of period $ 86,934 $121,769 $128,930
Net income (loss) (1,606) (27,684) 3,617
Common dividends (3) (36) (6,050) (10,733)
Preferred dividends (3,202) (1,477) (45)
Preferred stock Series H discount accretion (123) (37) —
Reset of convertible preferred stock conversion price (1,285) — —
Conversion of preferred stock to common stock (3,242) — —
Balance, end of year $ 77,440 $ 86,521 $121,769
Treasury stock, at cost
Balance, beginning of year $ (9,582) $ (21,724) $ (25,092) (221,676) (482,835) (565,422)
Issuance of shares pursuant to employee benefit plans 5,020 4,270 2,853 79,247 84,724 68,839
Treasury stock acquired (4) (3) (7) (663) (971) (343) (12,463)
Issuance of shares for Nikko acquisition —7,858 — —174,653 —
Issuance of shares for Grupo Cuscatlán acquisition —— 637 —— 14,192
Issuance of shares for ATD acquisition —— 503 —— 11,172
Other 22 21 38 567 2,125 847
Balance, end of year $ (4,543) $ (9,582) $ (21,724) (142,833) (221,676) (482,835)
(Statement continues on next page)