Citibank 2009 Annual Report Download - page 51
Download and view the complete annual report
Please find page 51 of the 2009 Citibank annual report below. You can navigate through the pages in the report by either clicking on the pages listed below, or by using the keyword search tool below to find specific information within the annual report.-
 1
1 -
2
-
3
-
4
-
5
-
6
-
7
-
8
-
9
-
10
-
11
-
12
-
13
-
14
-
15
-
16
-
17
-
18
-
19
-
20
-
21
-
22
-
23
-
24
-
25
-
26
-
27
-
28
-
29
-
30
-
31
-
32
-
33
-
34
-
35
-
36
-
37
-
38
-
39
-
40
-
 41
41 -
 42
42 -
 43
43 -
 44
44 -
 45
45 -
 46
46 -
 47
47 -
 48
48 -
 49
49 -
 50
50 -
 51
51 -
 52
52 -
 53
53 -
 54
54 -
 55
55 -
 56
56 -
 57
57 -
 58
58 -
 59
59 -
 60
60 -
 61
61 -
62
-
63
-
64
-
65
-
66
-
67
-
68
-
69
-
70
-
71
-
72
-
73
-
74
-
75
-
76
-
77
-
78
-
79
-
80
-
81
-
82
-
83
-
84
-
85
-
86
-
87
-
88
-
89
-
90
-
91
-
92
-
93
-
94
-
95
-
96
-
97
-
98
-
99
-
100
-
101
-
102
-
103
-
104
-
105
-
106
-
107
-
108
-
109
-
110
-
111
-
112
-
113
-
114
-
115
-
116
-
117
-
118
-
119
-
120
-
121
-
122
-
123
-
124
-
125
-
126
-
127
-
128
-
129
-
130
-
131
-
132
-
133
-
134
-
135
-
136
-
137
-
138
-
139
-
140
-
141
-
142
-
143
-
144
-
145
-
146
-
147
-
148
-
149
-
150
-
151
-
152
-
153
-
154
-
155
-
156
-
157
-
158
-
159
-
160
-
161
-
162
-
163
-
164
-
165
-
166
-
167
-
168
-
169
-
170
-
171
-
172
-
173
-
174
-
175
-
176
-
177
-
178
-
179
-
180
-
181
-
182
-
183
-
184
-
185
-
186
-
187
-
188
-
189
-
190
-
191
-
192
-
193
-
194
-
195
-
196
-
197
-
198
-
199
-
200
-
201
-
202
-
203
-
204
-
205
-
206
-
207
-
208
-
209
-
210
-
211
-
212
-
213
-
214
-
215
-
216
-
217
-
218
-
219
-
220
-
221
-
222
-
223
-
224
-
225
-
226
-
227
-
228
-
229
-
230
-
231
-
232
-
233
-
234
-
235
-
236
-
237
-
238
-
239
-
240
-
241
-
242
-
243
-
244
-
245
-
246
-
247
-
248
-
249
-
250
-
251
-
252
-
253
-
254
-
255
-
256
-
257
-
258
-
259
-
260
-
261
-
262
-
263
-
264
-
265
-
266
-
267
-
268
-
269
-
270
-
271
-
272
-
273
-
274
-
275
-
276
-
277
-
278
-
279
-
280
-
281
-
282
-
283
-
284
 |
 |
41
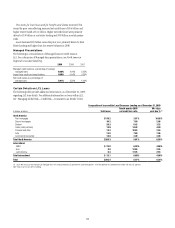
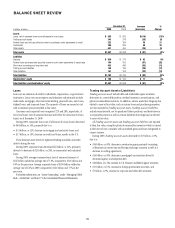
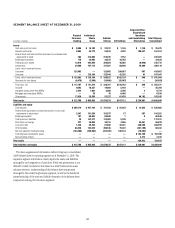
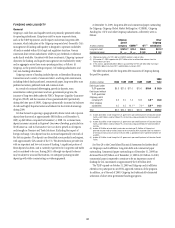
Deposits
Deposits represent customer funds that are payable on demand or upon
maturity. The majority of deposits are carried at cost, with a minimal
amount recorded at fair value. Deposits can be interest-bearing or non-
interest-bearing. Interest-bearing deposits payable by foreign and U.S.
domestic banking subsidiaries of Citigroup comprise 58% and 28% of total
deposits, respectively, while non-interest-bearing deposits comprise 5% and
9% of total deposits, respectively.
During 2009, total deposits increased by $62 billion, or 8%. Total average
deposits increased $10 billion or 1% during 2009.
For more information on deposits, see “Capital Resources and
Liquidity—Liquidity.”
Debt
Debt is composed of both short-term and long-term borrowings. It includes
commercial paper, borrowings from unaffiliated banks, senior notes
(including collateralized advances from the Federal Home Loan Bank),
subordinated notes and trust preferred securities. The majority of debt is
carried at cost, with approximately $27 billion recorded at fair value.
During 2009, total debt decreased by $53 billion, or 11%, with Short-term
borrowings decreasing by $58 billion, or 46%. Long-term debt increased by
only $5 billion, or 1%.
The decrease in Short-term borrowings was due to a decline of $39
billion in other funds borrowed and $19 billion in commercial paper
primarily caused by decreased need for short-term funding due to excess
liquidity caused by increased deposits and a reduction in assets.
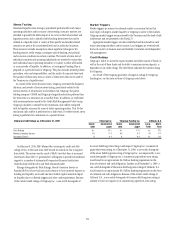
Average commercial paper outstanding in 2009 was $25 billion with an
average rate of 1.0%, compared to $32 billion and 3.1% in 2008. Average
other funds borrowed in 2009 were $77 billion, with an average rate of 1.5%,
compared to $83 billion and 1.7% in the prior year.
Average long-term debt outstanding during 2009 was $345 billion,
compared to $348 billion in 2008, with an average rate of 3.6% and
4.6%, respectively.
For more information on debt, see Note 20 to the Consolidated Financial
Statements and “Capital Resources and Liquidity—Liquidity.”