Citibank 2009 Annual Report Download - page 73
Download and view the complete annual report
Please find page 73 of the 2009 Citibank annual report below. You can navigate through the pages in the report by either clicking on the pages listed below, or by using the keyword search tool below to find specific information within the annual report.-
 1
1 -
2
-
3
-
4
-
5
-
6
-
7
-
8
-
9
-
10
-
11
-
12
-
13
-
14
-
15
-
16
-
17
-
18
-
19
-
20
-
21
-
22
-
23
-
24
-
25
-
26
-
27
-
28
-
29
-
30
-
31
-
32
-
33
-
34
-
35
-
36
-
37
-
38
-
39
-
40
-
41
-
42
-
43
-
44
-
45
-
46
-
47
-
48
-
49
-
50
-
51
-
52
-
53
-
54
-
55
-
56
-
57
-
58
-
59
-
60
-
61
-
62
-
 63
63 -
 64
64 -
 65
65 -
 66
66 -
 67
67 -
 68
68 -
 69
69 -
 70
70 -
 71
71 -
 72
72 -
 73
73 -
 74
74 -
 75
75 -
 76
76 -
 77
77 -
 78
78 -
 79
79 -
 80
80 -
 81
81 -
 82
82 -
 83
83 -
84
-
85
-
86
-
87
-
88
-
89
-
90
-
91
-
92
-
93
-
94
-
95
-
96
-
97
-
98
-
99
-
100
-
101
-
102
-
103
-
104
-
105
-
106
-
107
-
108
-
109
-
110
-
111
-
112
-
113
-
114
-
115
-
116
-
117
-
118
-
119
-
120
-
121
-
122
-
123
-
124
-
125
-
126
-
127
-
128
-
129
-
130
-
131
-
132
-
133
-
134
-
135
-
136
-
137
-
138
-
139
-
140
-
141
-
142
-
143
-
144
-
145
-
146
-
147
-
148
-
149
-
150
-
151
-
152
-
153
-
154
-
155
-
156
-
157
-
158
-
159
-
160
-
161
-
162
-
163
-
164
-
165
-
166
-
167
-
168
-
169
-
170
-
171
-
172
-
173
-
174
-
175
-
176
-
177
-
178
-
179
-
180
-
181
-
182
-
183
-
184
-
185
-
186
-
187
-
188
-
189
-
190
-
191
-
192
-
193
-
194
-
195
-
196
-
197
-
198
-
199
-
200
-
201
-
202
-
203
-
204
-
205
-
206
-
207
-
208
-
209
-
210
-
211
-
212
-
213
-
214
-
215
-
216
-
217
-
218
-
219
-
220
-
221
-
222
-
223
-
224
-
225
-
226
-
227
-
228
-
229
-
230
-
231
-
232
-
233
-
234
-
235
-
236
-
237
-
238
-
239
-
240
-
241
-
242
-
243
-
244
-
245
-
246
-
247
-
248
-
249
-
250
-
251
-
252
-
253
-
254
-
255
-
256
-
257
-
258
-
259
-
260
-
261
-
262
-
263
-
264
-
265
-
266
-
267
-
268
-
269
-
270
-
271
-
272
-
273
-
274
-
275
-
276
-
277
-
278
-
279
-
280
-
281
-
282
-
283
-
284
 |
 |
63
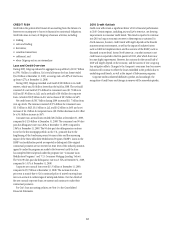
CREDIT RISK
Credit risk is the potential for financial loss resulting from the failure of a
borrower or counterparty to honor its financial or contractual obligations.
Credit risk arises in many of Citigroup’s business activities, including:
lending; •
sales and trading; •
derivatives; •
securities transactions; •
settlement; and •
when Citigroup acts as an intermediary.•
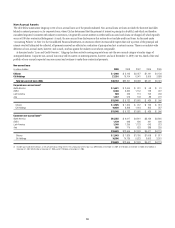
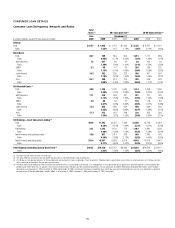
Loan and Credit Overview
During 2009, Citigroup reduced its aggregate loan portfolio by $102.7 billion
to $591.5 billion. In addition, Citi’s total allowance for loan losses totaled
$36.0 billion at December 31, 2009, a coverage ratio of 6.09% of total loans,
up from 4.27% at December 31, 2008.
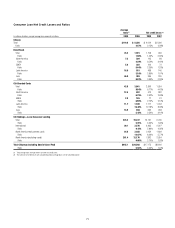
During 2009, Citigroup recorded a net build of $8.0 billion to its credit
reserves, which was $6.6 billion lower than the build in 2008. The net build
consisted of a net build of $7.6 billion for consumer loans ($1.7 billion in
RCB and $5.9 billion in LCL) and a net build of $0.4 billion for corporate
loans (a build of $0.9 billion in ICG and a release of $0.5 billion in SAP).
Net credit losses of $30.7 billion during 2009 increased $11.7 billion from
year-ago levels. The increase consisted of $7.6 billion for consumer loans
($1.3 billion in RCB, $6.1 billion in LCL and $0.2 billion in SAP) and a net
increase of $4.1 billion for corporate loans ($0.2 billion decrease in ICG offset
by a $4.3 billion increase in SAP).
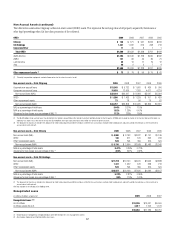
Consumer non-accrual loans totaled $18.6 billion at December 31, 2009,
compared to $12.6 billion at December 31, 2008. The consumer loan 90 days
past due delinquency rate was 4.82% at December 31, 2009, compared to
2.96% at December 31, 2008. The 90 days past due delinquencies continue
to rise for the first mortgage portfolio in the U.S., primarily due to the
lengthening of the foreclosure process by many states and the increasing
impact of the Home Affordable Modification Program (HAMP). Loans in the
HAMP trial modification period are reported as delinquent if the original
contractual payments are not received on time (even if the reduced payments
agreed to under the program are made by the borrower) until the loan
has completed the trial period under the program (see “Consumer Loan
Modification Programs” and “U.S. Consumer Mortgage Lending” below).
The 30 to 89 days past due delinquency rate was 3.56% at December 31, 2009,
compared to 3.51% at December 31, 2008.
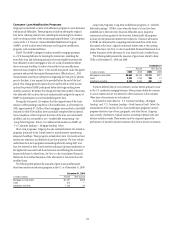
Corporate non-accrual loans were $13.5 billion at December 31, 2009,
compared to $9.7 billion at December 31, 2008. The increase from the
prior year is mainly due to Citi’s continued policy of actively moving loans
into non-accrual at earlier stages of anticipated distress. Over two-thirds of
the non-accrual corporate loans are current and continue to make their
contractual payments.
For Citi’s loan accounting policies, see Note 1 to the Consolidated
Financial Statements.
2010 Credit Outlook
Credit costs will remain a significant driver of Citi’s financial performance
in 2010. Certain regions, including Asia and Latin America, are showing
improvement in consumer credit trends. This trend is expected to continue
into 2010 as long as economic recovery in these regions is sustained. In
North America, however, credit trends will largely depend on the broader
macroeconomic environment, as well as the impact of industry factors
such as CARD Act implementation and the outcome of the HAMP, each as
discussed in more detail. Across North America, a modest increase in net
credit losses is expected in the first quarter of 2010, after which there may
be some slight improvement. However, the outcome for the second half of
2010 will largely depend on the economy, and the success of Citi’s ongoing
loss mitigation efforts. Changes to the Company’s consumer loan loss reserve
balances will continue to reflect the losses embedded in the portfolio due to
underlying credit trends, as well as the impact of forbearance programs.
Corporate credit is inherently difficult to predict, and accordingly, the
recognition of credit losses and changes in reserves will be somewhat episodic.