Citibank 2009 Annual Report Download - page 46
Download and view the complete annual report
Please find page 46 of the 2009 Citibank annual report below. You can navigate through the pages in the report by either clicking on the pages listed below, or by using the keyword search tool below to find specific information within the annual report.-
 1
1 -
2
-
3
-
4
-
5
-
6
-
7
-
8
-
9
-
10
-
11
-
12
-
13
-
14
-
15
-
16
-
17
-
18
-
19
-
20
-
21
-
22
-
23
-
24
-
25
-
26
-
27
-
28
-
29
-
30
-
31
-
32
-
33
-
34
-
35
-
 36
36 -
 37
37 -
 38
38 -
 39
39 -
 40
40 -
 41
41 -
 42
42 -
 43
43 -
 44
44 -
 45
45 -
 46
46 -
 47
47 -
 48
48 -
 49
49 -
 50
50 -
 51
51 -
 52
52 -
 53
53 -
 54
54 -
 55
55 -
 56
56 -
57
-
58
-
59
-
60
-
61
-
62
-
63
-
64
-
65
-
66
-
67
-
68
-
69
-
70
-
71
-
72
-
73
-
74
-
75
-
76
-
77
-
78
-
79
-
80
-
81
-
82
-
83
-
84
-
85
-
86
-
87
-
88
-
89
-
90
-
91
-
92
-
93
-
94
-
95
-
96
-
97
-
98
-
99
-
100
-
101
-
102
-
103
-
104
-
105
-
106
-
107
-
108
-
109
-
110
-
111
-
112
-
113
-
114
-
115
-
116
-
117
-
118
-
119
-
120
-
121
-
122
-
123
-
124
-
125
-
126
-
127
-
128
-
129
-
130
-
131
-
132
-
133
-
134
-
135
-
136
-
137
-
138
-
139
-
140
-
141
-
142
-
143
-
144
-
145
-
146
-
147
-
148
-
149
-
150
-
151
-
152
-
153
-
154
-
155
-
156
-
157
-
158
-
159
-
160
-
161
-
162
-
163
-
164
-
165
-
166
-
167
-
168
-
169
-
170
-
171
-
172
-
173
-
174
-
175
-
176
-
177
-
178
-
179
-
180
-
181
-
182
-
183
-
184
-
185
-
186
-
187
-
188
-
189
-
190
-
191
-
192
-
193
-
194
-
195
-
196
-
197
-
198
-
199
-
200
-
201
-
202
-
203
-
204
-
205
-
206
-
207
-
208
-
209
-
210
-
211
-
212
-
213
-
214
-
215
-
216
-
217
-
218
-
219
-
220
-
221
-
222
-
223
-
224
-
225
-
226
-
227
-
228
-
229
-
230
-
231
-
232
-
233
-
234
-
235
-
236
-
237
-
238
-
239
-
240
-
241
-
242
-
243
-
244
-
245
-
246
-
247
-
248
-
249
-
250
-
251
-
252
-
253
-
254
-
255
-
256
-
257
-
258
-
259
-
260
-
261
-
262
-
263
-
264
-
265
-
266
-
267
-
268
-
269
-
270
-
271
-
272
-
273
-
274
-
275
-
276
-
277
-
278
-
279
-
280
-
281
-
282
-
283
-
284
 |
 |

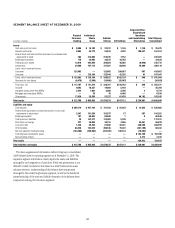
36
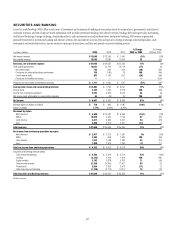
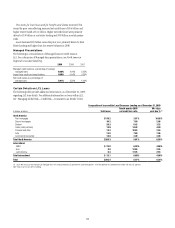
The following table provides details of the composition of SAP assets as of December 31, 2009.
Assets within Special Asset Pool as of December 31, 2009
In billions of dollars
Carrying value
of assets Face value
Carrying value as % of
face value
Securities in AFS/HTM (1)
Corporates $ 10.3 $10.6 97%
Prime and non-U.S. MBS 15.4 19.2 80
Auction rate securities 7.8 10.5 74
Alt-A mortgages 8.7 16.9 51
Other securities (2) 5.7 8.0 71
Total securities in AFS/HTM $ 47.9 $65.3 73%
Loans, leases and letters of credit (LCs) in HFI/HFS (3)
Corporates $ 20.3 $22.2 91%
Commercial real estate (CRE) 13.5 14.4 94
Other 3.4 4.1 83
Loan loss reserves (4.1) NM NM
Total loans, leases and LCs in HFI/HFS $ 33.1 NM NM
Mark-to-market
Subprime securities (4) $ 7.3 $18.9 39%
Other securities (5) 5.6 25.7 22
Derivatives 6.2 NM NM
Loans, leases and letters of credit 5.1 8.4 61
Repurchase agreements 6.5 NM NM
Total mark to market $ 30.7 NM NM
Highly leveraged finance commitments $ 2.8 $ 4.8 58%
Equities (excludes ARS in AFS) 11.3 NM NM
Structured investment vehicles 16.0 20.5 78
Monolines 1.0 NM NM
Consumer and other (6) 11.6 NM NM
Total $154.4
(1) Available-for-sale (AFS) accounts for approximately one-third of the total. HTM means held-to-maturity.
(2) Includes commercial real estate ($2.1 billion), municipals ($1.1 billion) and asset-backed securities ($1.5 billion).
(3) Held-for-sale (HFS) accounts for approximately $0.9 billion of the total.
(4) This $7.3 billion of assets is reflected in the exposures set forth under “Managing Global Risk—U.S. Subprime-Related Direct Exposure in Citi Holdings—Special Asset Pool.”
(5) Includes $1.9 billion of corporate and $0.7 billion of commercial real estate.
(6) Includes $4.6 billion of small business banking and finance loans.
Note: Totals may not sum due to rounding.
NM Not meaningful