Citibank 2009 Annual Report Download - page 134
Download and view the complete annual report
Please find page 134 of the 2009 Citibank annual report below. You can navigate through the pages in the report by either clicking on the pages listed below, or by using the keyword search tool below to find specific information within the annual report.-
 1
1 -
2
-
3
-
4
-
5
-
6
-
7
-
8
-
9
-
10
-
11
-
12
-
13
-
14
-
15
-
16
-
17
-
18
-
19
-
20
-
21
-
22
-
23
-
24
-
25
-
26
-
27
-
28
-
29
-
30
-
31
-
32
-
33
-
34
-
35
-
36
-
37
-
38
-
39
-
40
-
41
-
42
-
43
-
44
-
45
-
46
-
47
-
48
-
49
-
50
-
51
-
52
-
53
-
54
-
55
-
56
-
57
-
58
-
59
-
60
-
61
-
62
-
63
-
64
-
65
-
66
-
67
-
68
-
69
-
70
-
71
-
72
-
73
-
74
-
75
-
76
-
77
-
78
-
79
-
80
-
81
-
82
-
83
-
84
-
85
-
86
-
87
-
88
-
89
-
90
-
91
-
92
-
93
-
94
-
95
-
96
-
97
-
98
-
99
-
100
-
101
-
102
-
103
-
104
-
105
-
106
-
107
-
108
-
109
-
110
-
111
-
112
-
113
-
114
-
115
-
116
-
117
-
118
-
119
-
120
-
121
-
122
-
123
-
 124
124 -
 125
125 -
 126
126 -
 127
127 -
 128
128 -
 129
129 -
 130
130 -
 131
131 -
 132
132 -
 133
133 -
 134
134 -
 135
135 -
 136
136 -
 137
137 -
 138
138 -
 139
139 -
 140
140 -
 141
141 -
 142
142 -
 143
143 -
 144
144 -
145
-
146
-
147
-
148
-
149
-
150
-
151
-
152
-
153
-
154
-
155
-
156
-
157
-
158
-
159
-
160
-
161
-
162
-
163
-
164
-
165
-
166
-
167
-
168
-
169
-
170
-
171
-
172
-
173
-
174
-
175
-
176
-
177
-
178
-
179
-
180
-
181
-
182
-
183
-
184
-
185
-
186
-
187
-
188
-
189
-
190
-
191
-
192
-
193
-
194
-
195
-
196
-
197
-
198
-
199
-
200
-
201
-
202
-
203
-
204
-
205
-
206
-
207
-
208
-
209
-
210
-
211
-
212
-
213
-
214
-
215
-
216
-
217
-
218
-
219
-
220
-
221
-
222
-
223
-
224
-
225
-
226
-
227
-
228
-
229
-
230
-
231
-
232
-
233
-
234
-
235
-
236
-
237
-
238
-
239
-
240
-
241
-
242
-
243
-
244
-
245
-
246
-
247
-
248
-
249
-
250
-
251
-
252
-
253
-
254
-
255
-
256
-
257
-
258
-
259
-
260
-
261
-
262
-
263
-
264
-
265
-
266
-
267
-
268
-
269
-
270
-
271
-
272
-
273
-
274
-
275
-
276
-
277
-
278
-
279
-
280
-
281
-
282
-
283
-
284
 |
 |

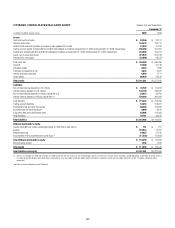
124
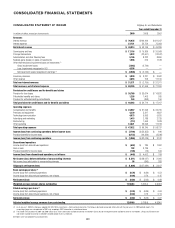
CONSOLIDATED STATEMENT OF CASH FLOWS Citigroup Inc. and Subsidiaries
Year ended December 31
In millions of dollars 2009 2008 2007
Cash flows from operating activities of continuing operations
Net income (loss) before attribution of noncontrolling interests $ (1,511) $ (28,027) $ 3,900
Net income (loss) attributable to noncontrolling interests 95 (343) 283
Citigroup’s net income (loss) $ (1,606) $ (27,684) $ 3,617
Income (loss) from discontinued operations, net of taxes (402) 1,070 708
Gain (loss) on sale, net of taxes (43) 2,932 —
Income (loss) from continuing operations—excluding noncontrolling interests $ (1,161) $ (31,686) $ 2,909
Adjustments to reconcile net income (loss) to net cash (used in) provided by operating activities of continuing operations
Amortization of deferred policy acquisition costs and present value of future profits $ 434 $ 206 $ 369
Additions to deferred policy acquisition costs (461) (397) (482)
Depreciation and amortization 2,853 2,466 2,421
Deferred tax benefit (7,709) (20,535) (3,927)
Provision for credit losses 39,004 33,311 16,982
Change in trading account assets 25,864 123,845 (62,798)
Change in trading account liabilities (25,382) (14,604) 20,893
Change in federal funds sold and securities borrowed or purchased under agreements to resell (43,726) 89,933 38,143
Change in federal funds purchased and securities loaned or sold under agreements to repurchase (47,669) (98,950) (56,983)
Change in brokerage receivables net of brokerage payables 1,847 (954) (15,529)
Realized gains from sales of investments (1,996) (679) (1,168)
Change in loans held-for-sale (1,711) 29,009 (30,649)
Other, net 4,094 (14,445) 18,268
Total adjustments $ (54,558) $ 128,206 $ (74,460)
Net cash (used in) provided by operating activities of continuing operations $ (55,719) $ 96,520 $ (71,551)
Cash flows from investing activities of continuing operations
Change in deposits with banks $ 2,519 $ (100,965) $ (17,216)
Change in loans (148,651) (270,521) (361,934)
Proceeds from sales and securitizations of loans 241,367 313,808 273,464
Purchases of investments (281,115) (344,336) (274,426)
Proceeds from sales of investments 85,395 93,666 211,753
Proceeds from maturities of investments 133,614 209,312 121,346
Capital expenditures on premises and equipment (1,146) (2,541) (4,003)
Proceeds from sales of premises and equipment, subsidiaries and affiliates, and repossessed assets 6,303 23,966 4,253
Business acquisitions —— (15,614)
Net cash provided by (used in) investing activities of continuing operations $ 38,286 $ (77,611) $ (62,377)
Cash flows from financing activities of continuing operations
Dividends paid $ (3,237) $ (7,526) $ (10,778)
Issuance of common stock 17,514 6,864 1,060
Issuances (redemptions) of preferred stock, net —70,626 (1,000)
Issuances of T-DECs - APIC 2,784 — —
Treasury stock acquired (3) (7) (663)
Stock tendered for payment of withholding taxes (120) (400) (951)
Issuance of long-term debt 110,088 90,414 118,496
Payments and redemptions of long-term debt (123,743) (132,901) (65,517)
Change in deposits 61,718 (37,811) 93,422
Change in short-term borrowings (51,995) (13,796) 10,425
Net cash provided by (used in) financing activities of continuing operations $ 13,006 $ (24,537) $ 144,494
Effect of exchange rate changes on cash and cash equivalents $ 632 $ (2,948) $ 1,005
Discontinued operations
Net cash provided by (used in) discontinued operations $ 14 $ (377) $ 121
Change in cash and due from banks $ (3,781) $ (8,953) $ 11,692
Cash and due from banks at beginning of period 29,253 38,206 26,514
Cash and due from banks at end of period $ 25,472 $ 29,253 $ 38,206
Supplemental disclosure of cash flow information for continuing operations
Cash (received) paid during the year for income taxes $ (289) $ 3,170 $ 5,923
Cash paid during the year for interest $ 28,389 $ 55,678 $ 72,732
Non-cash investing activities
Transfers to repossessed assets $ 2,880 $ 3,439 $ 2,287
Transfers to investments (held-to-maturity) from trading account assets —33,258 —
Transfers to investments (available-for-sale) from trading account assets —4,654 —
Transfers to loans held for investment (loans) from loans held-for-sale —$ 15,891 —
See Notes to the Consolidated Financial Statements.