Citibank 2009 Annual Report Download - page 240
Download and view the complete annual report
Please find page 240 of the 2009 Citibank annual report below. You can navigate through the pages in the report by either clicking on the pages listed below, or by using the keyword search tool below to find specific information within the annual report.-
 1
1 -
2
-
3
-
4
-
5
-
6
-
7
-
8
-
9
-
10
-
11
-
12
-
13
-
14
-
15
-
16
-
17
-
18
-
19
-
20
-
21
-
22
-
23
-
24
-
25
-
26
-
27
-
28
-
29
-
30
-
31
-
32
-
33
-
34
-
35
-
36
-
37
-
38
-
39
-
40
-
41
-
42
-
43
-
44
-
45
-
46
-
47
-
48
-
49
-
50
-
51
-
52
-
53
-
54
-
55
-
56
-
57
-
58
-
59
-
60
-
61
-
62
-
63
-
64
-
65
-
66
-
67
-
68
-
69
-
70
-
71
-
72
-
73
-
74
-
75
-
76
-
77
-
78
-
79
-
80
-
81
-
82
-
83
-
84
-
85
-
86
-
87
-
88
-
89
-
90
-
91
-
92
-
93
-
94
-
95
-
96
-
97
-
98
-
99
-
100
-
101
-
102
-
103
-
104
-
105
-
106
-
107
-
108
-
109
-
110
-
111
-
112
-
113
-
114
-
115
-
116
-
117
-
118
-
119
-
120
-
121
-
122
-
123
-
124
-
125
-
126
-
127
-
128
-
129
-
130
-
131
-
132
-
133
-
134
-
135
-
136
-
137
-
138
-
139
-
140
-
141
-
142
-
143
-
144
-
145
-
146
-
147
-
148
-
149
-
150
-
151
-
152
-
153
-
154
-
155
-
156
-
157
-
158
-
159
-
160
-
161
-
162
-
163
-
164
-
165
-
166
-
167
-
168
-
169
-
170
-
171
-
172
-
173
-
174
-
175
-
176
-
177
-
178
-
179
-
180
-
181
-
182
-
183
-
184
-
185
-
186
-
187
-
188
-
189
-
190
-
191
-
192
-
193
-
194
-
195
-
196
-
197
-
198
-
199
-
200
-
201
-
202
-
203
-
204
-
205
-
206
-
207
-
208
-
209
-
210
-
211
-
212
-
213
-
214
-
215
-
216
-
217
-
218
-
219
-
220
-
221
-
222
-
223
-
224
-
225
-
226
-
227
-
228
-
229
-
 230
230 -
 231
231 -
 232
232 -
 233
233 -
 234
234 -
 235
235 -
 236
236 -
 237
237 -
 238
238 -
 239
239 -
 240
240 -
 241
241 -
 242
242 -
 243
243 -
 244
244 -
 245
245 -
 246
246 -
 247
247 -
 248
248 -
 249
249 -
 250
250 -
251
-
252
-
253
-
254
-
255
-
256
-
257
-
258
-
259
-
260
-
261
-
262
-
263
-
264
-
265
-
266
-
267
-
268
-
269
-
270
-
271
-
272
-
273
-
274
-
275
-
276
-
277
-
278
-
279
-
280
-
281
-
282
-
283
-
284
 |
 |

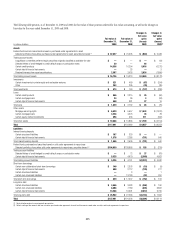
230
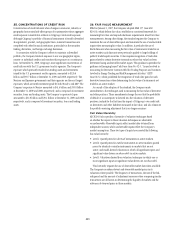
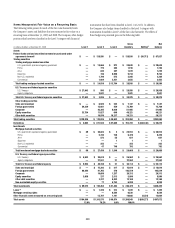
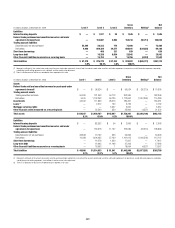
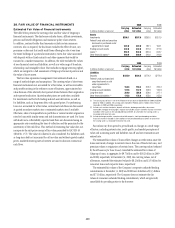
Changes in Level 3 Fair Value Category
The following tables present the changes in the Level 3 fair value category
for the years ended December 31, 2009 and 2008. The Company classifies
financial instruments in Level 3 of the fair value hierarchy when there is
reliance on at least one significant unobservable input to the valuation
model. In addition to these unobservable inputs, the valuation models for
Level 3 financial instruments typically also rely on a number of inputs that
are readily observable either directly or indirectly. Thus, the gains and losses
presented below include changes in the fair value related to both observable
and unobservable inputs.
The Company often hedges positions with offsetting positions that are
classified in a different level. For example, the gains and losses for assets
and liabilities in the Level 3 category presented in the tables below do not
reflect the effect of offsetting losses and gains on hedging instruments that
have been classified by the Company in the Level 1 and Level 2 categories. In
addition, the Company hedges items classified in the Level 3 category with
instruments also classified in Level 3 of the fair value hierarchy. The effects of
these hedges are presented gross in the following tables.
December 31,
2008
Net realized/unrealized
gains (losses) included in Transfers
in and/or
out of
Level 3
Purchases,
issuances
and
settlements
December 31,
2009
Unrealized
gains
(losses)
still held (3)
In millions of dollars
Principal
transactions Other (1) (2)
Assets
Trading securities
Trading mortgage-backed securities
U.S. government-sponsored agency guaranteed $ 1,325 $ 243 $ — $ 35 $ (631) $ 972 $ 317
Prime 147 (295) — 498 34 384 (179)
Alt-A 1,153 (78) — (374) (314) 387 73
Subprime 13,844 233 — (997) (4,082) 8,998 472
Non-U.S. residential 858 (23) — (617) 354 572 125
Commercial 2,949 (256) — 362 (604) 2,451 (762)
Total trading mortgage-backed securities $20,276 $ (176) $ — $(1,093) $(5,243) $ 13,764 $ 46
U.S. Treasury and federal agencies securities
U.S. Treasury $ — $ — $ — $ — $ — $ — $ —
Agency obligations 59 (108) — (54) 103 — —
Total U.S. Treasury and federal
agencies securities $ 59 $ (108) $ — $ (54) $ 103 $ — $ —
State and municipal $ 233 $ (67) $ — $ 219 $ (163) $ 222 $ 4
Foreign government 1,261 112 — (396) (518) 459 3
Corporate 13,027 (184) — (1,492) (2,731) 8,620 (449)
Equity securities 1,387 260 — (1,147) 140 640 (22)
Other debt securities 14,530 1,637 — (2,520) 2,590 16,237 53
Total trading securities $50,773 $ 1,474 $ — $(6,483) $(5,822) $ 39,942 $ (365)
Derivatives, net (4) $ 3,586 $(4,878) $ — $ 80 $ 4,320 $ 3,108 $(4,854)
Investments
Mortgage-backed securities
U.S. government-sponsored agency guaranteed $ — $ — $ 1 $ 77 $ (76) $ 2 $ —
Prime 1,163 — 201 61 (689) 736 417
Alt-A 111 — 42 (61) (37) 55 —
Subprime 25 — (7) (19) 2 1 —
Commercial 964 — 87 (461) 156 746 8
Total investment mortgage-backed
debt securities $ 2,263 $ — $ 324 $ (403) $ (644) $ 1,540 $ 425
U.S. Treasury and federal agencies securities
Agency obligations $ — $ — $ — $ 26 $ (5) $ 21 $ —
Total U.S. Treasury and federal
agencies securities $ — $ — $ — $ 26 $ (5) $ 21 $ —
State and municipal $ 222 $ — $ 2 $ (13) $ 6 $ 217 $ —
Foreign government 571 — (6) (302) 7 270 (3)
Corporate 1,019 — 13 762 (537) 1,257 16
Equity securities 3,807 — (453) (146) (695) 2,513 41
Other debt securities 11,324 — 279 (1,292) (1,479) 8,832 (81)
Non-marketable equity securities 9,067 — (538) (137) (1,639) 6,753 69
Total investments $28,273 $ — $(379) $(1,505) $(4,986) $ 21,403 $ 467