Citibank 2008 Annual Report Download - page 97
Download and view the complete annual report
Please find page 97 of the 2008 Citibank annual report below. You can navigate through the pages in the report by either clicking on the pages listed below, or by using the keyword search tool below to find specific information within the annual report.-
 1
1 -
2
-
3
-
4
-
5
-
6
-
7
-
8
-
9
-
10
-
11
-
12
-
13
-
14
-
15
-
16
-
17
-
18
-
19
-
20
-
21
-
22
-
23
-
24
-
25
-
26
-
27
-
28
-
29
-
30
-
31
-
32
-
33
-
34
-
35
-
36
-
37
-
38
-
39
-
40
-
41
-
42
-
43
-
44
-
45
-
46
-
47
-
48
-
49
-
50
-
51
-
52
-
53
-
54
-
55
-
56
-
57
-
58
-
59
-
60
-
61
-
62
-
63
-
64
-
65
-
66
-
67
-
68
-
69
-
70
-
71
-
72
-
73
-
74
-
75
-
76
-
77
-
78
-
79
-
80
-
81
-
82
-
83
-
84
-
85
-
86
-
 87
87 -
 88
88 -
 89
89 -
 90
90 -
 91
91 -
 92
92 -
 93
93 -
 94
94 -
 95
95 -
 96
96 -
 97
97 -
 98
98 -
 99
99 -
 100
100 -
 101
101 -
 102
102 -
 103
103 -
 104
104 -
 105
105 -
 106
106 -
 107
107 -
108
-
109
-
110
-
111
-
112
-
113
-
114
-
115
-
116
-
117
-
118
-
119
-
120
-
121
-
122
-
123
-
124
-
125
-
126
-
127
-
128
-
129
-
130
-
131
-
132
-
133
-
134
-
135
-
136
-
137
-
138
-
139
-
140
-
141
-
142
-
143
-
144
-
145
-
146
-
147
-
148
-
149
-
150
-
151
-
152
-
153
-
154
-
155
-
156
-
157
-
158
-
159
-
160
-
161
-
162
-
163
-
164
-
165
-
166
-
167
-
168
-
169
-
170
-
171
-
172
-
173
-
174
-
175
-
176
-
177
-
178
-
179
-
180
-
181
-
182
-
183
-
184
-
185
-
186
-
187
-
188
-
189
-
190
-
191
-
192
-
193
-
194
-
195
-
196
-
197
-
198
-
199
-
200
-
201
-
202
-
203
-
204
-
205
-
206
-
207
-
208
-
209
-
210
-
211
-
212
-
213
-
214
-
215
-
216
-
217
-
218
-
219
-
220
-
221
-
222
-
223
-
224
-
225
-
226
-
227
-
228
-
229
-
230
-
231
-
232
-
233
-
234
-
235
-
236
-
237
-
238
-
239
-
240
-
241
-
242
-
243
-
244
-
245
-
246
-
247
-
248
-
249
-
250
-
251
-
252
 |
 |

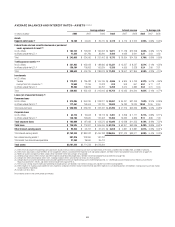
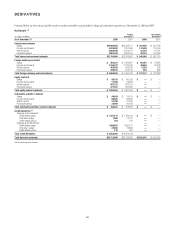
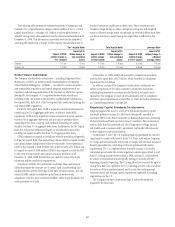
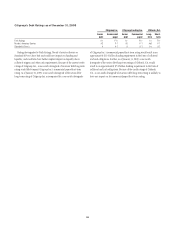
Mark-to-Market (MTM) Receivables/Payables
In millions of dollars
Derivatives
receivables—MTM
Derivatives
payables—MTM
As of December 31 2008 2007 (6) 2008 2007 (6)
Trading derivatives (2)
Interest rate contracts $ 667,597 $ 237,711 $ 654,178 $ 237,903
Foreign exchange contracts 153,197 77,937 160,628 71,980
Equity contracts 35,717 27,381 57,292 66,916
Commodity and other contracts 23,924 8,540 22,473 8,887
Credit derivatives: (4)
Citigroup as the Guarantor 5,890 4,967 198,233 73,103
Citigroup as the Beneficiary 222,461 78,426 5,476 11,191
Cash collateral paid/received (3) 63,866 32,247 65,010 19,437
Total $ 1,172,652 $ 467,209 $ 1,163,290 $ 489,417
Less: Netting agreements and market value adjustments (1,057,363) (390,328) (1,046,505) (385,876)
Net receivables/payables $ 115,289 $ 76,881 $ 116,785 $ 103,541
Non-trading derivatives (5)
Interest rate contracts $ 14,755 $ 8,529 $ 7,742 $ 7,176
Foreign exchange contracts 2,408 1,634 3,746 972
Total $ 17,163 $ 10,163 $ 11,488 $ 8,148
(1) Includes the notional amounts for long and short derivative positions.
(2) Trading derivatives include proprietary positions, as well as certain hedging derivatives instruments that qualify for hedge accounting in accordance with SFAS No. 133, Accounting for Derivative Instruments and
Hedging Activities (SFAS 133).
(3) In addition to the cash collateral paid or received, as of December 31, 2008 the Company has provided $7.9 billion and received $6.8 billion of marketable securities as collateral under derivative contracts.
(4) Credit derivatives are arrangements designed to allow one party (the “beneficiary”) to transfer the credit risk of a “reference asset” to another party (the “guarantor”). These arrangements allow a guarantor to assume
the credit risk associated with the reference asset without directly purchasing it. The Company has entered into credit derivatives positions for purposes such as risk management, yield enhancement, reduction of credit
concentrations and diversification of overall risk.
(5) Non-trading derivatives include only those end-user derivative instruments where the changes in market value are recorded in Other assets or Other liabilities.
(6) Reclassified to conform to the current period’s presentation.
Derivative Obligor Information
The following table presents the global derivatives portfolio by internal
obligor credit rating at December 31, 2008 and 2007, as a percentage of
credit exposure:
December 31,
2008
December 31,
2007
AAA/AA/A 68% 80%
BBB 20 11
BB/B 77
CCC or below 51
Unrated —1
Total 100% 100%
The following table presents the global derivatives portfolio by industry of
the obligor as a percentage of credit exposure:
2008 2007
Financial institutions 73% 75%
Governments 76
Corporations 20 19
Total 100% 100%
Fair Valuation Adjustments for Derivatives
The fair value adjustments applied by the Company to its derivative carrying
values consist of the following items:
• Liquidity adjustments are applied to items in Level 2 or Level 3 of the fair-
value hierarchy (see Note 26 on page 192 for more details) to ensure that
the fair value reflects the price at which the entire position could be
liquidated. The liquidity reserve is based on the bid/offer spread for an
instrument, adjusted to take into account the size of the position.
• Credit valuation adjustments (CVA) are applied to over-the-counter
derivative instruments, in which the base valuation generally discounts
expected cash flows using LIBOR interest rate curves. Because not all
counterparties have the same credit risk as that implied by the relevant
LIBOR curve, a CVA is necessary to incorporate the market view of both
counterparty credit risk and the Company’s own credit risk in the
valuation.
The Company’s CVA methodology comprises two steps. First, the exposure
profile for each counterparty is determined using the terms of all individual
derivative positions and a Monte Carlo simulation or other quantitative
analysis to generate a series of expected cash flows at future points in time.
The calculation of this exposure profile considers the effect of credit risk
mitigants, including pledged cash or other collateral and any legal right of
offset that exists with a counterparty through arrangements such as netting
agreements. Individual derivative contracts that are subject to an enforceable
master netting agreement with a counterparty are aggregated for this
purpose, since it is those aggregate net cash flows that are subject to
nonperformance risk. This process identifies specific, point in time future
cash flows that are subject to nonperformance risk, rather than using the
current recognized net asset or liability as a basis to measure the CVA.
Second, market-based views of default probabilities derived from observed
credit spreads in the credit default swap market, are applied to the expected
91