Citibank 2008 Annual Report Download - page 68
Download and view the complete annual report
Please find page 68 of the 2008 Citibank annual report below. You can navigate through the pages in the report by either clicking on the pages listed below, or by using the keyword search tool below to find specific information within the annual report.-
 1
1 -
2
-
3
-
4
-
5
-
6
-
7
-
8
-
9
-
10
-
11
-
12
-
13
-
14
-
15
-
16
-
17
-
18
-
19
-
20
-
21
-
22
-
23
-
24
-
25
-
26
-
27
-
28
-
29
-
30
-
31
-
32
-
33
-
34
-
35
-
36
-
37
-
38
-
39
-
40
-
41
-
42
-
43
-
44
-
45
-
46
-
47
-
48
-
49
-
50
-
51
-
52
-
53
-
54
-
55
-
56
-
57
-
 58
58 -
 59
59 -
 60
60 -
 61
61 -
 62
62 -
 63
63 -
 64
64 -
 65
65 -
 66
66 -
 67
67 -
 68
68 -
 69
69 -
 70
70 -
 71
71 -
 72
72 -
 73
73 -
 74
74 -
 75
75 -
 76
76 -
 77
77 -
 78
78 -
79
-
80
-
81
-
82
-
83
-
84
-
85
-
86
-
87
-
88
-
89
-
90
-
91
-
92
-
93
-
94
-
95
-
96
-
97
-
98
-
99
-
100
-
101
-
102
-
103
-
104
-
105
-
106
-
107
-
108
-
109
-
110
-
111
-
112
-
113
-
114
-
115
-
116
-
117
-
118
-
119
-
120
-
121
-
122
-
123
-
124
-
125
-
126
-
127
-
128
-
129
-
130
-
131
-
132
-
133
-
134
-
135
-
136
-
137
-
138
-
139
-
140
-
141
-
142
-
143
-
144
-
145
-
146
-
147
-
148
-
149
-
150
-
151
-
152
-
153
-
154
-
155
-
156
-
157
-
158
-
159
-
160
-
161
-
162
-
163
-
164
-
165
-
166
-
167
-
168
-
169
-
170
-
171
-
172
-
173
-
174
-
175
-
176
-
177
-
178
-
179
-
180
-
181
-
182
-
183
-
184
-
185
-
186
-
187
-
188
-
189
-
190
-
191
-
192
-
193
-
194
-
195
-
196
-
197
-
198
-
199
-
200
-
201
-
202
-
203
-
204
-
205
-
206
-
207
-
208
-
209
-
210
-
211
-
212
-
213
-
214
-
215
-
216
-
217
-
218
-
219
-
220
-
221
-
222
-
223
-
224
-
225
-
226
-
227
-
228
-
229
-
230
-
231
-
232
-
233
-
234
-
235
-
236
-
237
-
238
-
239
-
240
-
241
-
242
-
243
-
244
-
245
-
246
-
247
-
248
-
249
-
250
-
251
-
252
 |
 |
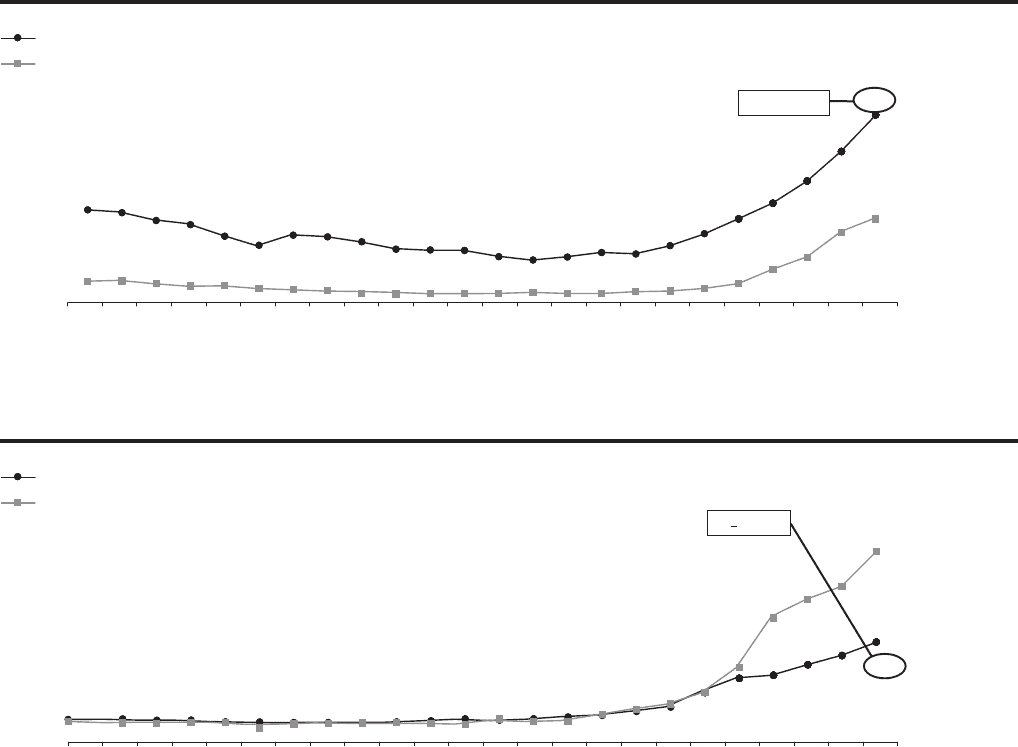
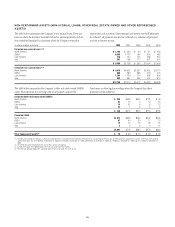
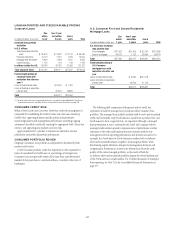
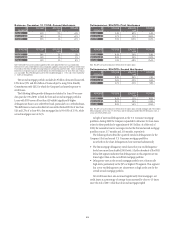
First mortgage net credit losses as a percentage of average loans are
nearly half the level of those in the second mortgage portfolio, despite much
higher delinquencies in the first mortgage portfolio. Two major factors
explain this relationship:
• First mortgages include government-guaranteed loans.
• Second mortgages are much more likely to go directly from delinquency
to charge-off without going into foreclosure.
During 2008, the Company increased its efforts to contain the rise in
delinquencies and mitigate losses. The Company continues to tighten credit
requirements through higher FICOs, lower LTVs, increased documentation
and verifications. This shift has resulted in loans originated in 2008 having
higher FICO scores and lower LTVs, on average, than those originated in
2007.
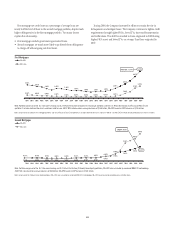
2.82%
4.61%
3.02%
5.71%
0.63% 0.56% 0.49% 0.37% 0.32% 0.25%
2.16%
1.00%
2.57%
2.07%
1.47%
2.04%
2.51%
1.40% 1.38%
1.58%
1.84%
2.05%
0.31% 0.41%
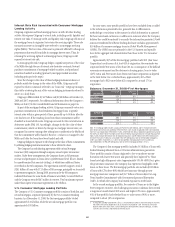
90+DPD
NCL ratio
First Mortgages
Note: Portfolio comprised of the U.S. Consumer Lending and U.S. Retail Distribution (Citibank) first mortgage portfolios and the U.S. Retail Distribution (CitiFinancial) Real Estate
portfolio. It includes deferred fees/costs and loans held for sale. 4Q’07 NCL ratio based on average balances of $156 billion, 90+DPD based on EOP balances of $155 billion.
FICO<620: 11.77%
0.26%
0.26%
1Q03 2Q03 3Q03 4Q03 1Q04 2Q04 3Q04 4Q04 1Q05 2Q05 3Q05 4Q05 1Q06 2Q06 3Q06 4Q06 1Q07 2Q07 3Q07 3Q082Q081Q084Q07 4Q08
Note: comprised of the Citibank first mortgage portfolios and the CitiFinancial Real Estate portfolio. It includes deferred fees/costs and loans held for sale. 90+DPD based on end of period balances of $137.5 billion.
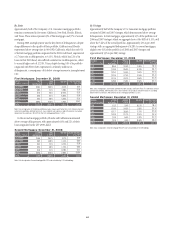
Second Mortgages
Note: Portfolio comprised of the U.S. Consumer Lending and U.S. Retail Distribution (Citibank) Home Equity portfolios; 90+DPD rate calculated by combined MBA/OTS methodology.
4Q’07 NCL ratio based on average balances of $64 billion, 90+DPD based on EOP balances of $63 billion.
90+DPD
NCL ratio
5.05%
0.17%
2.03%
1.45%
2.41%
0.11% 0.09% 0.09% 0.04% 0.06% 0.06%
4.03%
3.16%
0.99%
0.41%
0.11%
0.15%
0.14% 0.14%
0.13%
0.09%
0.08%
0.47% 0.94%
0.25%
0.15%
1Q03 2Q03 3Q03 4Q03 1Q04 2Q04 3Q04 4Q04 1Q05 2Q05 3Q05 4Q05 1Q06 2Q06 3Q06 4Q06 1Q07 2Q07 3Q07 3Q082Q081Q084Q07 4Q08
LTV>90: 4.69%
Note: comprised of the Citibank Home Equity portfolios; 90+DPD rate calculated by combined MBA/OTS methodology. 90+DPD based on end of period balances of $59.6 billion.
62