Citibank 2008 Annual Report Download - page 64
Download and view the complete annual report
Please find page 64 of the 2008 Citibank annual report below. You can navigate through the pages in the report by either clicking on the pages listed below, or by using the keyword search tool below to find specific information within the annual report.-
 1
1 -
2
-
3
-
4
-
5
-
6
-
7
-
8
-
9
-
10
-
11
-
12
-
13
-
14
-
15
-
16
-
17
-
18
-
19
-
20
-
21
-
22
-
23
-
24
-
25
-
26
-
27
-
28
-
29
-
30
-
31
-
32
-
33
-
34
-
35
-
36
-
37
-
38
-
39
-
40
-
41
-
42
-
43
-
44
-
45
-
46
-
47
-
48
-
49
-
50
-
51
-
52
-
53
-
 54
54 -
 55
55 -
 56
56 -
 57
57 -
 58
58 -
 59
59 -
 60
60 -
 61
61 -
 62
62 -
 63
63 -
 64
64 -
 65
65 -
 66
66 -
 67
67 -
 68
68 -
 69
69 -
 70
70 -
 71
71 -
 72
72 -
 73
73 -
 74
74 -
75
-
76
-
77
-
78
-
79
-
80
-
81
-
82
-
83
-
84
-
85
-
86
-
87
-
88
-
89
-
90
-
91
-
92
-
93
-
94
-
95
-
96
-
97
-
98
-
99
-
100
-
101
-
102
-
103
-
104
-
105
-
106
-
107
-
108
-
109
-
110
-
111
-
112
-
113
-
114
-
115
-
116
-
117
-
118
-
119
-
120
-
121
-
122
-
123
-
124
-
125
-
126
-
127
-
128
-
129
-
130
-
131
-
132
-
133
-
134
-
135
-
136
-
137
-
138
-
139
-
140
-
141
-
142
-
143
-
144
-
145
-
146
-
147
-
148
-
149
-
150
-
151
-
152
-
153
-
154
-
155
-
156
-
157
-
158
-
159
-
160
-
161
-
162
-
163
-
164
-
165
-
166
-
167
-
168
-
169
-
170
-
171
-
172
-
173
-
174
-
175
-
176
-
177
-
178
-
179
-
180
-
181
-
182
-
183
-
184
-
185
-
186
-
187
-
188
-
189
-
190
-
191
-
192
-
193
-
194
-
195
-
196
-
197
-
198
-
199
-
200
-
201
-
202
-
203
-
204
-
205
-
206
-
207
-
208
-
209
-
210
-
211
-
212
-
213
-
214
-
215
-
216
-
217
-
218
-
219
-
220
-
221
-
222
-
223
-
224
-
225
-
226
-
227
-
228
-
229
-
230
-
231
-
232
-
233
-
234
-
235
-
236
-
237
-
238
-
239
-
240
-
241
-
242
-
243
-
244
-
245
-
246
-
247
-
248
-
249
-
250
-
251
-
252
 |
 |

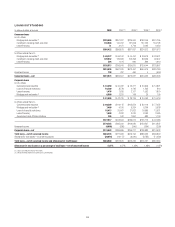
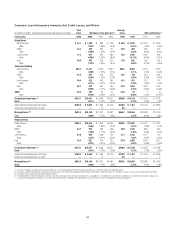
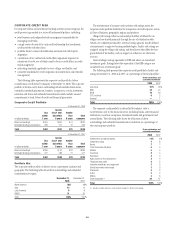
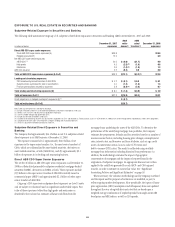
Consumer Loan Delinquency Amounts, Net Credit Losses, and Ratios
In millions of dollars, except total and average loan amounts in billions
Total
loans 90 days or more past due (1)
Average
loans Net credit losses (1)
Product View: 2008 2008 2007 2006 2008 2008 2007 2006
Global Cards
North America $ 45.2 $ 1,298 $ 896 $ 798 $ 43.6 $ 2,970 $ 2,054 $ 1,928
Ratio 2.87% 1.88% 1.60% 6.81% 4.69% 4.09%
EMEA 14.2 369 233 114 15.6 664 340 303
Ratio 2.60% 1.53% 1.60% 4.23% 2.80% 4.94%
Latin America 11.5 561 551 380 13.8 1,682 1,025 552
Ratio 4.86% 3.92% 3.84% 12.17% 8.60% 6.91%
Asia 16.6 262 249 207 17.0 602 458 425
Ratio 1.57% 1.50% 1.54% 3.53% 3.15% 3.48%
Consumer Banking
North America 284.4 11,271 6,453 3,655 298.2 8,098 3,015 1,834
Ratio 3.96% 2.13% 1.34% 2.71% 1.04% 0.72%
EMEA 21.6 547 322 373 24.5 718 524 336
Ratio 2.54% 1.32% 2.12% 2.92% 2.36% 2.09%
Latin America 14.0 422 457 364 15.1 621 251 147
Ratio 3.01% 3.07% 3.30% 4.10% 1.90% 1.44%
Asia 52.7 522 457 459 57.5 1,841 1,587 1,257
Ratio 0.99% 0.77% 0.89% 3.19% 2.90% 2.59%
GWM 55.5 289 30 21 63.5 52 1 (4)
Ratio 0.52% 0.05% 0.05% 0.08% 0.00% (0.01)%
On-balance-sheet loans (2) $515.7 $15,541 $ 9,648 $6,371 $548.8 $17,248 $ 9,255 $ 6,778
Ratio 3.01% 1.73% 1.33% 3.13% 1.79% 1.52%
Securitized receivables (all in NA Cards) $105.9 $ 2,655 $ 1,864 $1,616 $106.9 $ 7,407 $ 4,728 $ 3,986
Credit card receivables held-for-sale (3) ——15 — 0.5 — —5
Managed loans (4) $621.6 $18,196 $11,527 $7,987 $656.2 $24,655 $13,983 $10,769
Ratio 2.92% 1.73% 1.38% 3.75% 2.26% 1.98%
Regional view:
North America $365.7 $12,815 $ 7,376 $4,465 $380.5 $11,092 $ 5,072 $ 3,761
Ratio 3.50% 1.89% 1.27% 2.91% 1.38% 1.14%
EMEA 42.7 922 555 488 49.6 1,385 862 640
Ratio 2.16% 1.14% 1.65% 2.79% 2.06% 2.44%
Latin America 27.9 983 1,008 744 31.7 2,303 1,277 700
Ratio 3.51% 3.21% 3.23% 7.25% 4.63% 3.43%
Asia 79.4 821 709 674 87.0 2,468 2,044 1,677
Ratio 0.97% 0.81% 0.92% 2.83% 2.58% 2.44%
On-balance-sheet loans (2) $515.7 $15,541 $ 9,648 $6,371 $548.8 $17,248 $ 9,255 $ 6,788
Ratio 3.01% 1.73% 1.33% 3.13% 1.79% 1.52%
Securitized receivables (all in NA Cards) $105.9 $ 2,655 $ 1,864 $1,616 $106.9 $ 7,407 $ 4,728 $ 3,986
Credit card receivables held-for-sale (3) ——15 — 0.5 — —5
Managed loans (4) $621.6 $18,196 $11,527 $7,987 $656.2 $24,655 $13,983 $10,769
Ratio 2.92% 1.73% 1.38% 3.75% 2.26% 1.98%
(1) The ratios of 90 days or more past due and net credit losses are calculated based on end-of-period and average loans, respectively, both net of unearned income.
(2) Total loans and total average loans exclude certain interest and fees on credit cards of approximately $3 billion and $2 billion, respectively, which are included in Consumer loans on the Consolidated Balance Sheet.
(3) Included in Other assets on the Consolidated Balance Sheet.
(4) This table presents credit information on a held basis and shows the impact of securitizations to reconcile to a managed basis. Only North America Cards from a product view, and North America from a regional view,
are affected. Managed-basis reporting is a non-GAAP measure. Held-basis reporting is the related GAAP measure. See a discussion of managed-basis reporting on page 57.
58