Citibank 2008 Annual Report Download - page 113
Download and view the complete annual report
Please find page 113 of the 2008 Citibank annual report below. You can navigate through the pages in the report by either clicking on the pages listed below, or by using the keyword search tool below to find specific information within the annual report.-
 1
1 -
2
-
3
-
4
-
5
-
6
-
7
-
8
-
9
-
10
-
11
-
12
-
13
-
14
-
15
-
16
-
17
-
18
-
19
-
20
-
21
-
22
-
23
-
24
-
25
-
26
-
27
-
28
-
29
-
30
-
31
-
32
-
33
-
34
-
35
-
36
-
37
-
38
-
39
-
40
-
41
-
42
-
43
-
44
-
45
-
46
-
47
-
48
-
49
-
50
-
51
-
52
-
53
-
54
-
55
-
56
-
57
-
58
-
59
-
60
-
61
-
62
-
63
-
64
-
65
-
66
-
67
-
68
-
69
-
70
-
71
-
72
-
73
-
74
-
75
-
76
-
77
-
78
-
79
-
80
-
81
-
82
-
83
-
84
-
85
-
86
-
87
-
88
-
89
-
90
-
91
-
92
-
93
-
94
-
95
-
96
-
97
-
98
-
99
-
100
-
101
-
102
-
 103
103 -
 104
104 -
 105
105 -
 106
106 -
 107
107 -
 108
108 -
 109
109 -
 110
110 -
 111
111 -
 112
112 -
 113
113 -
 114
114 -
 115
115 -
 116
116 -
 117
117 -
 118
118 -
 119
119 -
 120
120 -
 121
121 -
 122
122 -
 123
123 -
124
-
125
-
126
-
127
-
128
-
129
-
130
-
131
-
132
-
133
-
134
-
135
-
136
-
137
-
138
-
139
-
140
-
141
-
142
-
143
-
144
-
145
-
146
-
147
-
148
-
149
-
150
-
151
-
152
-
153
-
154
-
155
-
156
-
157
-
158
-
159
-
160
-
161
-
162
-
163
-
164
-
165
-
166
-
167
-
168
-
169
-
170
-
171
-
172
-
173
-
174
-
175
-
176
-
177
-
178
-
179
-
180
-
181
-
182
-
183
-
184
-
185
-
186
-
187
-
188
-
189
-
190
-
191
-
192
-
193
-
194
-
195
-
196
-
197
-
198
-
199
-
200
-
201
-
202
-
203
-
204
-
205
-
206
-
207
-
208
-
209
-
210
-
211
-
212
-
213
-
214
-
215
-
216
-
217
-
218
-
219
-
220
-
221
-
222
-
223
-
224
-
225
-
226
-
227
-
228
-
229
-
230
-
231
-
232
-
233
-
234
-
235
-
236
-
237
-
238
-
239
-
240
-
241
-
242
-
243
-
244
-
245
-
246
-
247
-
248
-
249
-
250
-
251
-
252
 |
 |

FAIR VALUATION
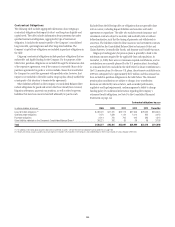
The following table shows the expected versus actual rate of return on
plan assets for the U.S. pension and postretirement plans:
2008 2007 2006
Expected rate of return 7.75% 8.0% 8.0%
Actual rate of return (5.42)% 13.2% 14.7%
For the foreign plans, pension expense for 2008 was reduced by the
expected return of $487 million, compared with the actual return of $(883)
million. Pension expense for 2007 and 2006 was reduced by expected returns
of $477 million and $384 million, respectively. Actual returns were higher in
2007 and 2006 than the expected returns in those years.
Discount Rate
The 2008 and 2007 discount rates for the U.S. pension and postretirement
plans were selected by reference to a Citigroup-specific analysis using each
plan’s specific cash flows and compared with the Moody’s Aa Long-Term
Corporate Bond Yield for reasonableness. Citigroup’s policy is to round to the
nearest tenth of a percent. Accordingly, at December 31, 2008, the discount
rate was set at 6.1% for the pension plans and at 6.0% for the postretirement
welfare plans.
At December 31, 2007, the discount rate was set at 6.2% for the pension
plans and 6.0% for the postretirement plans, referencing a Citigroup-specific
cash flow analysis.
As of September 30, 2006, the U.S. pension plan was remeasured to reflect
the freeze of benefits accruals for all non-grandfathered participants,
effective January 1, 2008. Under the September 30, 2006 remeasurement and
year-end analysis, the resulting plan-specific discount rate for the pension
plan was 5.86%, which was rounded to 5.9%.
The discount rates for the foreign pension and postretirement plans are
selected by reference to high-quality corporate bond rates in countries that
have developed corporate bond markets. However, where developed corporate
bond markets do not exist, the discount rates are selected by reference to
local government bond rates with a premium added to reflect the additional
risk for corporate bonds.
For additional information on the pension and postretirement plans, and
on discount rates used in determining pension and postretirement benefit
obligations and net benefit expense for the Company’s plans, as well as the
effects of a one percentage-point change in the expected rates of return and
the discount rates, see Note 9 to the Company’s Consolidated Financial
Statements on page 144.
Adoption of SFAS 158
Upon the adoption of SFAS No. 158, Employer’s Accounting for Defined
Benefit Pensions and Other Postretirement Benefits (SFAS 158), at
December 31, 2006, the Company recorded an after-tax charge to equity of
$1.6 billion, which corresponds to the plans’ net pension and postretirement
liabilities and the write-off of the existing prepaid asset, which relates to
unamortized actuarial gains and losses, prior service costs/benefits and
transition assets/liabilities.
For a discussion of fair value of assets and liabilities, see “Significant
Accounting Policies and Significant Estimates” on page 18 and Notes 26, 27
and 28 to the Consolidated Financial Statements on pages 192, 202 and 207.
107