Citibank 2008 Annual Report Download - page 211
Download and view the complete annual report
Please find page 211 of the 2008 Citibank annual report below. You can navigate through the pages in the report by either clicking on the pages listed below, or by using the keyword search tool below to find specific information within the annual report.-
 1
1 -
2
-
3
-
4
-
5
-
6
-
7
-
8
-
9
-
10
-
11
-
12
-
13
-
14
-
15
-
16
-
17
-
18
-
19
-
20
-
21
-
22
-
23
-
24
-
25
-
26
-
27
-
28
-
29
-
30
-
31
-
32
-
33
-
34
-
35
-
36
-
37
-
38
-
39
-
40
-
41
-
42
-
43
-
44
-
45
-
46
-
47
-
48
-
49
-
50
-
51
-
52
-
53
-
54
-
55
-
56
-
57
-
58
-
59
-
60
-
61
-
62
-
63
-
64
-
65
-
66
-
67
-
68
-
69
-
70
-
71
-
72
-
73
-
74
-
75
-
76
-
77
-
78
-
79
-
80
-
81
-
82
-
83
-
84
-
85
-
86
-
87
-
88
-
89
-
90
-
91
-
92
-
93
-
94
-
95
-
96
-
97
-
98
-
99
-
100
-
101
-
102
-
103
-
104
-
105
-
106
-
107
-
108
-
109
-
110
-
111
-
112
-
113
-
114
-
115
-
116
-
117
-
118
-
119
-
120
-
121
-
122
-
123
-
124
-
125
-
126
-
127
-
128
-
129
-
130
-
131
-
132
-
133
-
134
-
135
-
136
-
137
-
138
-
139
-
140
-
141
-
142
-
143
-
144
-
145
-
146
-
147
-
148
-
149
-
150
-
151
-
152
-
153
-
154
-
155
-
156
-
157
-
158
-
159
-
160
-
161
-
162
-
163
-
164
-
165
-
166
-
167
-
168
-
169
-
170
-
171
-
172
-
173
-
174
-
175
-
176
-
177
-
178
-
179
-
180
-
181
-
182
-
183
-
184
-
185
-
186
-
187
-
188
-
189
-
190
-
191
-
192
-
193
-
194
-
195
-
196
-
197
-
198
-
199
-
200
-
 201
201 -
 202
202 -
 203
203 -
 204
204 -
 205
205 -
 206
206 -
 207
207 -
 208
208 -
 209
209 -
 210
210 -
 211
211 -
 212
212 -
 213
213 -
 214
214 -
 215
215 -
 216
216 -
 217
217 -
 218
218 -
 219
219 -
 220
220 -
 221
221 -
222
-
223
-
224
-
225
-
226
-
227
-
228
-
229
-
230
-
231
-
232
-
233
-
234
-
235
-
236
-
237
-
238
-
239
-
240
-
241
-
242
-
243
-
244
-
245
-
246
-
247
-
248
-
249
-
250
-
251
-
252
 |
 |

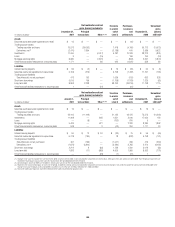
The notional amount of these unfunded letters of credit was $1.4 billion
as of December 31, 2008 and December 31, 2007. The amount funded was
insignificant with no amounts 90 days or more past due or on a non-accrual
status at December 31, 2008 and December 31, 2007.
These items have been classified appropriately in Trading account assets
or Trading account liabilities on the Consolidated Balance Sheet. Changes
in fair value of these items are classified in Principal transactions in the
Company’s Consolidated Statement of Income.
Other items for which the fair-value option was selected
in accordance with SFAS 159
The Company has elected the fair-value option for the following eligible
items, which did not affect opening Retained earnings:
• certain credit products;
• certain investments in private equity and real estate ventures and certain
equity-method investments;
• certain structured liabilities;
• certain non-structured liabilities; and
• certain mortgage loans
Certain credit products
Citigroup has elected the fair-value option for certain originated and purchased
loans, including certain unfunded loan products, such as guarantees and
letters of credit, executed by Citigroup’s trading businesses. None of these credit
products is a highly leveraged financing commitment. Significant groups of
transactions include loans and unfunded loan products that are expected to be
either sold or securitized in the near term, or transactions where the economic
risks are hedged with derivative instruments such as purchased credit default
swaps or total return swaps where the Company pays the total return on the
underlying loans to a third party. Citigroup has elected the fair-value option to
mitigate accounting mismatches in cases where hedge accounting is complex
and to achieve operational simplifications. Fair value was not elected for most
lending transactions across the Company, including where those management
objectives would not be met.
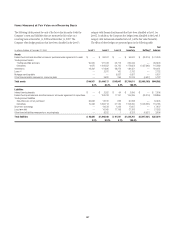
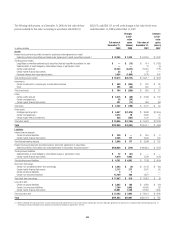
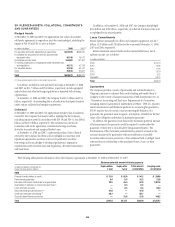
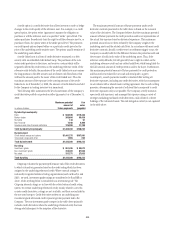
The following table provides information about certain credit products
carried at fair value:
2008 2007
In millions of dollars
Trading
assets Loans
Trading
assets Loans
Carrying amount reported on the
Consolidated Balance Sheet $16,254 $2,315 $26,020 $3,038
Aggregate unpaid principal balance in
excess of fair value $ 6,501 $ 3 $ 899 $ (5)
Balance on non-accrual loans or loans
more than 90 days past due $ 77 $1,113 $ 186 $1,292
Aggregate unpaid principal balance in
excess of fair value for non-accrual
loans or loans more than 90 days
past due $ 190 $ (4) $68$—
In addition to the amounts reported above, $72 million and $141 million
of unfunded loan commitments related to certain credit products selected for
fair-value accounting were outstanding as of December 31, 2008 and
December 31, 2007, respectively.
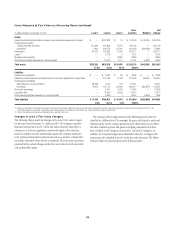
Changes in fair value of funded and unfunded credit products are classified
in Principal transactions in the Company’s Consolidated Statement of
Income. Related interest revenue is measured based on the contractual interest
rates and reported as Interest revenue on trading account assets or loans
depending on their balance sheet classifications. The changes in fair value for
the years ended December 31, 2008 and 2007 due to instrument-specific credit
risk totaled to a loss of $38 million and $188 million, respectively.
Certain investments in private equity and real estate
ventures and certain equity method investments
Citigroup invests in private equity and real estate ventures for the purpose of
earning investment returns and for capital appreciation. The Company has
elected the fair-value option for certain of these ventures, because such
investments are considered similar to many private equity or hedge fund
activities in our investment companies, which are reported at fair value. The
fair-value option brings consistency in the accounting and evaluation of
certain of these investments. As required by SFAS 159, all investments (debt
and equity) in such private equity and real estate entities are accounted for
at fair value. These investments are classified as Investments on Citigroup’s
Consolidated Balance Sheet.
Citigroup also holds various non-strategic investments in leveraged
buyout funds and other hedge funds that previously were required to be
accounted for under the equity method. The Company elected fair-value
accounting to reduce operational and accounting complexity. Since the
funds account for all of their underlying assets at fair value, the impact of
applying the equity method to Citigroup’s investment in these funds was
equivalent to fair-value accounting. Thus, this fair-value election had no
impact on opening Retained earnings. These investments are classified as
Other assets on Citigroup’s Consolidated Balance Sheet.
Changes in the fair values of these investments are classified in Other
revenue in the Company’s Consolidated Statement of Income.
Certain structured liabilities
The Company has elected the fair-value option for certain structured
liabilities whose performance is linked to structured interest rates, inflation
or currency risks (“structured liabilities”). The Company elected the fair-
value option, because these exposures are considered to be trading-related
positions and, therefore, are managed on a fair-value basis. These positions
will continue to be classified as debt, deposits or derivatives (Trading
account liabilities) on the Company’s Consolidated Balance Sheet
according to their legal form.
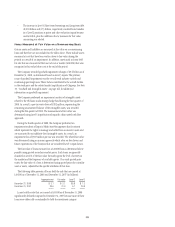
For those structured liabilities classified as Long-term debt for which the
fair-value option has been elected, the aggregate unpaid principal balance
exceeds the aggregate fair value of such instruments by $277 million as of
December 31, 2008 and $7 million as of December 31, 2007.
The change in fair value for these structured liabilities is reported in
Principal transactions in the Company’s Consolidated Statement of
Income.
Related interest expense is measured based on the contractual interest
rates and reported as such in the Consolidated Income Statement.
Certain non-structured liabilities
The Company has elected the fair-value option for certain non-structured
liabilities with fixed and floating interest rates (“non-structured liabilities”).
205