Citibank 2008 Annual Report Download - page 80
Download and view the complete annual report
Please find page 80 of the 2008 Citibank annual report below. You can navigate through the pages in the report by either clicking on the pages listed below, or by using the keyword search tool below to find specific information within the annual report.-
 1
1 -
2
-
3
-
4
-
5
-
6
-
7
-
8
-
9
-
10
-
11
-
12
-
13
-
14
-
15
-
16
-
17
-
18
-
19
-
20
-
21
-
22
-
23
-
24
-
25
-
26
-
27
-
28
-
29
-
30
-
31
-
32
-
33
-
34
-
35
-
36
-
37
-
38
-
39
-
40
-
41
-
42
-
43
-
44
-
45
-
46
-
47
-
48
-
49
-
50
-
51
-
52
-
53
-
54
-
55
-
56
-
57
-
58
-
59
-
60
-
61
-
62
-
63
-
64
-
65
-
66
-
67
-
68
-
69
-
 70
70 -
 71
71 -
 72
72 -
 73
73 -
 74
74 -
 75
75 -
 76
76 -
 77
77 -
 78
78 -
 79
79 -
 80
80 -
 81
81 -
 82
82 -
 83
83 -
 84
84 -
 85
85 -
 86
86 -
 87
87 -
 88
88 -
 89
89 -
 90
90 -
91
-
92
-
93
-
94
-
95
-
96
-
97
-
98
-
99
-
100
-
101
-
102
-
103
-
104
-
105
-
106
-
107
-
108
-
109
-
110
-
111
-
112
-
113
-
114
-
115
-
116
-
117
-
118
-
119
-
120
-
121
-
122
-
123
-
124
-
125
-
126
-
127
-
128
-
129
-
130
-
131
-
132
-
133
-
134
-
135
-
136
-
137
-
138
-
139
-
140
-
141
-
142
-
143
-
144
-
145
-
146
-
147
-
148
-
149
-
150
-
151
-
152
-
153
-
154
-
155
-
156
-
157
-
158
-
159
-
160
-
161
-
162
-
163
-
164
-
165
-
166
-
167
-
168
-
169
-
170
-
171
-
172
-
173
-
174
-
175
-
176
-
177
-
178
-
179
-
180
-
181
-
182
-
183
-
184
-
185
-
186
-
187
-
188
-
189
-
190
-
191
-
192
-
193
-
194
-
195
-
196
-
197
-
198
-
199
-
200
-
201
-
202
-
203
-
204
-
205
-
206
-
207
-
208
-
209
-
210
-
211
-
212
-
213
-
214
-
215
-
216
-
217
-
218
-
219
-
220
-
221
-
222
-
223
-
224
-
225
-
226
-
227
-
228
-
229
-
230
-
231
-
232
-
233
-
234
-
235
-
236
-
237
-
238
-
239
-
240
-
241
-
242
-
243
-
244
-
245
-
246
-
247
-
248
-
249
-
250
-
251
-
252
 |
 |
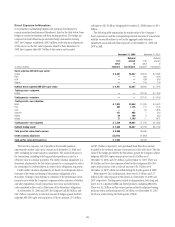
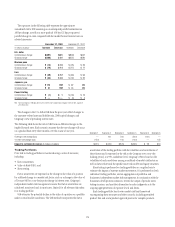
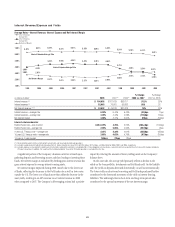
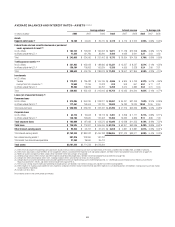
Total revenues of the trading business consist of:
• customer revenue, which includes spreads from customer flow and
positions taken to facilitate customer orders;
• proprietary trading activities in both cash and derivative transactions; and
• net interest revenue.
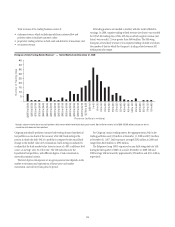
All trading positions are marked to market, with the result reflected in
earnings. In 2008, negative trading-related revenue (net losses) was recorded
for 109 of 260 trading days. Of the 109 days on which negative revenue (net
losses) was recorded, 21 were greater than $400 million. The following
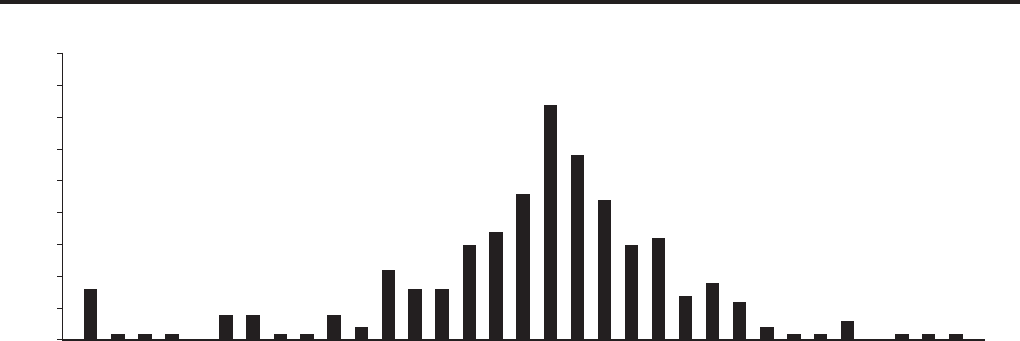
histogram of total daily revenue or loss captures trading volatility and shows
the number of days in which the Company’s trading-related revenues fell
within particular ranges.
($600) to ($550)
Histogram of Daily Trading-Related Revenue*
-
Twelve Months Ended December 31, 2008
-
5
10
15
20
40
35
30
25
45
Revenue (dollars in millions)
Number of Trading Days
*Includes subprime-related losses on credit positions which were marked intermittently during each month. Most of the loss events in the $800-$4,500 million category are due to
cumulative write-downs on these positions.
($4500) to ($800)
($50) to 0
($100) to ($50)
($150) to ($100)
($200) to ($150)
($250) to ($200)
($300) to ($250)
($350) to ($300)
($400) to ($350)
($450) to ($400)
($500) to ($450)
($550) to ($500)
($650) to ($600)
($700) to ($650)
($750) to ($700)
($800) to ($750)
0 to 50
50 to 100
100 to 150
150 to 200
200 to 250
250 to 300
300 to 350
350 to 400
400 to 450
450 to 500
500 to 550
550 to 600
600 to 650
650 to 700
700 to 750
750 to 800
Citigroup periodically performs extensive back-testing of many hypothetical
test portfolios as one check of the accuracy of its VAR. Back-testing is the
process in which the daily VAR of a portfolio is compared to the actual daily
change in the market value of its transactions. Back-testing is conducted to
confirm that the daily market value losses in excess of a 99% confidence level
occur, on average, only 1% of the time. The VAR calculation for the
hypothetical test portfolios, with different degrees of risk concentration,
meets this statistical criteria.
The level of price risk exposure at any given point in time depends on the
market environment and expectations of future price and market
movements, and will vary from period to period.
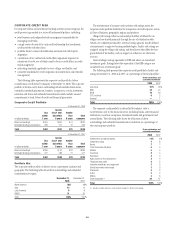
For Citigroup’s major trading centers, the aggregate pretax VAR in the
trading portfolios was $319 million at December 31, 2008 and $191 million
at December 31, 2007. Daily exposures averaged $292 million in 2008 and
ranged from $220 million to $393 million.
The Subprime Group (SPG) exposures became fully integrated into VAR
during the first quarter of 2008. As a result, December 31, 2008 VAR and
2008 average VAR increased by approximately $29 million and $111 million,
respectively.
74