Citibank 2008 Annual Report Download - page 145
Download and view the complete annual report
Please find page 145 of the 2008 Citibank annual report below. You can navigate through the pages in the report by either clicking on the pages listed below, or by using the keyword search tool below to find specific information within the annual report.-
 1
1 -
2
-
3
-
4
-
5
-
6
-
7
-
8
-
9
-
10
-
11
-
12
-
13
-
14
-
15
-
16
-
17
-
18
-
19
-
20
-
21
-
22
-
23
-
24
-
25
-
26
-
27
-
28
-
29
-
30
-
31
-
32
-
33
-
34
-
35
-
36
-
37
-
38
-
39
-
40
-
41
-
42
-
43
-
44
-
45
-
46
-
47
-
48
-
49
-
50
-
51
-
52
-
53
-
54
-
55
-
56
-
57
-
58
-
59
-
60
-
61
-
62
-
63
-
64
-
65
-
66
-
67
-
68
-
69
-
70
-
71
-
72
-
73
-
74
-
75
-
76
-
77
-
78
-
79
-
80
-
81
-
82
-
83
-
84
-
85
-
86
-
87
-
88
-
89
-
90
-
91
-
92
-
93
-
94
-
95
-
96
-
97
-
98
-
99
-
100
-
101
-
102
-
103
-
104
-
105
-
106
-
107
-
108
-
109
-
110
-
111
-
112
-
113
-
114
-
115
-
116
-
117
-
118
-
119
-
120
-
121
-
122
-
123
-
124
-
125
-
126
-
127
-
128
-
129
-
130
-
131
-
132
-
133
-
134
-
 135
135 -
 136
136 -
 137
137 -
 138
138 -
 139
139 -
 140
140 -
 141
141 -
 142
142 -
 143
143 -
 144
144 -
 145
145 -
 146
146 -
 147
147 -
 148
148 -
 149
149 -
 150
150 -
 151
151 -
 152
152 -
 153
153 -
 154
154 -
 155
155 -
156
-
157
-
158
-
159
-
160
-
161
-
162
-
163
-
164
-
165
-
166
-
167
-
168
-
169
-
170
-
171
-
172
-
173
-
174
-
175
-
176
-
177
-
178
-
179
-
180
-
181
-
182
-
183
-
184
-
185
-
186
-
187
-
188
-
189
-
190
-
191
-
192
-
193
-
194
-
195
-
196
-
197
-
198
-
199
-
200
-
201
-
202
-
203
-
204
-
205
-
206
-
207
-
208
-
209
-
210
-
211
-
212
-
213
-
214
-
215
-
216
-
217
-
218
-
219
-
220
-
221
-
222
-
223
-
224
-
225
-
226
-
227
-
228
-
229
-
230
-
231
-
232
-
233
-
234
-
235
-
236
-
237
-
238
-
239
-
240
-
241
-
242
-
243
-
244
-
245
-
246
-
247
-
248
-
249
-
250
-
251
-
252
 |
 |

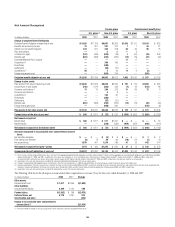
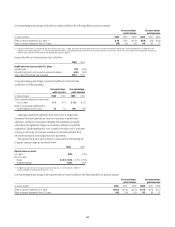
5. INTEREST REVENUE AND EXPENSE
For the years ended December 31, 2008, 2007 and 2006, respectively, interest
revenue and expense consisted of the following:
In millions of dollars 2008 2007 2006
Interest revenue
Loan interest, including fees $ 62,336 $ 63,201 $52,086
Deposits with banks 3,119 3,113 2,240
Federal funds sold and securities
purchased under agreements to resell 9,175 18,354 14,199
Investments, including dividends 10,718 13,423 10,340
Trading account assets (1) 17,489 18,507 11,865
Other interest 3,818 4,831 2,881
Total interest revenue $106,655 $121,429 $93,611
Interest expense
Deposits $ 20,271 $ 28,402 $21,336
Federal funds purchased and securities loaned
or sold under agreements to repurchase 11,330 23,028 17,448
Trading account liabilities (1) 1,277 1,440 1,119
Short-term borrowings 4,039 7,071 4,632
Long-term debt 16,046 16,110 11,148
Total interest expense $ 52,963 $ 76,051 $55,683
Net interest revenue $ 53,692 $ 45,378 $37,928
Provision for loan losses 33,674 $ 16,832 $ 6,320
Net interest revenue after provision for
loan losses $ 20,018 $ 28,546 $31,608
(1) Interest expense on Trading account liabilities of ICG is reported as a reduction of interest revenue
from Trading account assets.
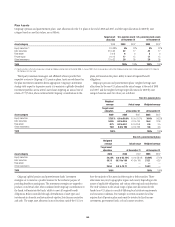
6. COMMISSIONS AND FEES
Commissions and fees revenue includes charges to customers for credit and
bank cards, including transaction-processing fees and annual fees; advisory
and equity and debt underwriting services; lending and deposit-related
transactions, such as loan commitments, standby letters of credit and other
deposit and loan servicing activities; investment management-related fees,
including brokerage services and custody and trust services; and insurance
fees and commissions.
The following table presents commissions and fees revenue for the years
ended December 31:
In millions of dollars 2008 2007 2006
Investment banking $ 2,284 $ 5,228 $ 4,093
Credit cards and bank cards 4,517 5,036 5,191
Smith Barney 2,836 3,265 2,958
ICG trading-related 2,322 2,706 2,464
Checking-related 1,134 1,108 911
Transaction Services 1,423 1,166 859
Other Consumer 1,211 649 279
Nikko Cordial-related (1) 1,086 834 —
Loan servicing (2) (1,731) 560 660
Primerica 415 455 399
Other ICG 747 295 243
Other (141) 71 58
Corporate finance (3) (4,876) (667) 735
Total commissions and fees $11,227 $20,706 $18,850
(1) Commissions and fees for Nikko Cordial have not been detailed due to unavailability of the information.
(2) Includes fair value adjustments on mortgage servicing assets. The mark-to-market on the underlying
economic hedges of the MSRs is included in Other revenue.
(3) Includes write-downs of approximately $4.9 billion in 2008 and $1.5 billion in 2007, net of
underwriting fees, on funded and unfunded highly leveraged finance commitments, recorded at fair
value and reported as loans held for sale in Other assets. Write-downs were recorded on all highly
leveraged finance commitments where there was value impairment, regardless of funding date.
139