Citibank 2008 Annual Report Download - page 67
Download and view the complete annual report
Please find page 67 of the 2008 Citibank annual report below. You can navigate through the pages in the report by either clicking on the pages listed below, or by using the keyword search tool below to find specific information within the annual report.-
 1
1 -
2
-
3
-
4
-
5
-
6
-
7
-
8
-
9
-
10
-
11
-
12
-
13
-
14
-
15
-
16
-
17
-
18
-
19
-
20
-
21
-
22
-
23
-
24
-
25
-
26
-
27
-
28
-
29
-
30
-
31
-
32
-
33
-
34
-
35
-
36
-
37
-
38
-
39
-
40
-
41
-
42
-
43
-
44
-
45
-
46
-
47
-
48
-
49
-
50
-
51
-
52
-
53
-
54
-
55
-
56
-
 57
57 -
 58
58 -
 59
59 -
 60
60 -
 61
61 -
 62
62 -
 63
63 -
 64
64 -
 65
65 -
 66
66 -
 67
67 -
 68
68 -
 69
69 -
 70
70 -
 71
71 -
 72
72 -
 73
73 -
 74
74 -
 75
75 -
 76
76 -
 77
77 -
78
-
79
-
80
-
81
-
82
-
83
-
84
-
85
-
86
-
87
-
88
-
89
-
90
-
91
-
92
-
93
-
94
-
95
-
96
-
97
-
98
-
99
-
100
-
101
-
102
-
103
-
104
-
105
-
106
-
107
-
108
-
109
-
110
-
111
-
112
-
113
-
114
-
115
-
116
-
117
-
118
-
119
-
120
-
121
-
122
-
123
-
124
-
125
-
126
-
127
-
128
-
129
-
130
-
131
-
132
-
133
-
134
-
135
-
136
-
137
-
138
-
139
-
140
-
141
-
142
-
143
-
144
-
145
-
146
-
147
-
148
-
149
-
150
-
151
-
152
-
153
-
154
-
155
-
156
-
157
-
158
-
159
-
160
-
161
-
162
-
163
-
164
-
165
-
166
-
167
-
168
-
169
-
170
-
171
-
172
-
173
-
174
-
175
-
176
-
177
-
178
-
179
-
180
-
181
-
182
-
183
-
184
-
185
-
186
-
187
-
188
-
189
-
190
-
191
-
192
-
193
-
194
-
195
-
196
-
197
-
198
-
199
-
200
-
201
-
202
-
203
-
204
-
205
-
206
-
207
-
208
-
209
-
210
-
211
-
212
-
213
-
214
-
215
-
216
-
217
-
218
-
219
-
220
-
221
-
222
-
223
-
224
-
225
-
226
-
227
-
228
-
229
-
230
-
231
-
232
-
233
-
234
-
235
-
236
-
237
-
238
-
239
-
240
-
241
-
242
-
243
-
244
-
245
-
246
-
247
-
248
-
249
-
250
-
251
-
252
 |
 |
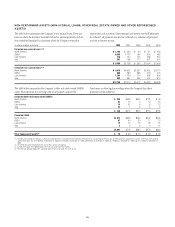
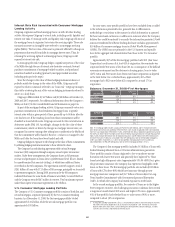
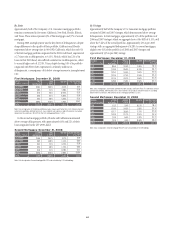
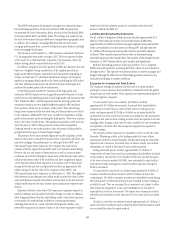
Balances: December 31, 2008—Second Mortgages
LTV 80%
80%<LTV<90%
LTV 90%
FICO<620
<1%
<1%
<1%
620 FICO
<660
2%
1%
1%
FICO 660
51%
16%
29%
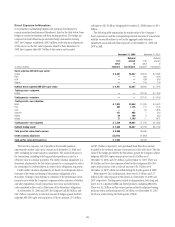
AT
ORIGINATION
LTV 80%
80%<LTV<90%
LTV 90%
FICO<620
2%
1%
6%
620 FICO
<660
2%
1%
3%
FICO 660
36%
15%
34%
REFRESHED
Note: Refreshed FICO scores based on updated credit scores obtained from Fair Isaac Corporation.
Refreshed LTV ratios are derived from data at origination updated using mainly the S&P/Case-Shiller Home
Price Index or the Office of Federal Housing Enterprise Oversight Housing Price Index. Tables exclude $0.7
billion from At Origination balances and $0.1 billion from Refreshed balances for which FICO and LTV data
was unavailable. 90+ DPD delinquency rate for the excluded mortgages is 1.72% and 2.10% respectively,
vs. 2.39% for total portfolio.
The second mortgage portfolio includes $2.9 billion of insured loans with
LTVs above 90% and $2.6 billion of loans subject to Long-Term Standby
Commitments with GSE, for which the Company has limited exposure to
credit losses.
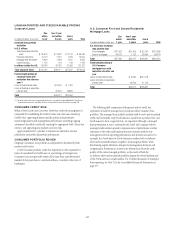
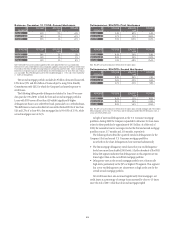
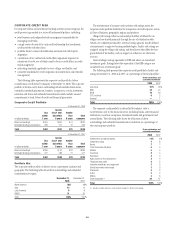
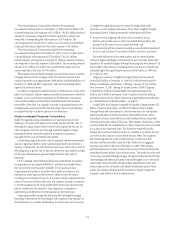
The following tables provide delinquency statistics for loans 90 or more
days past due (90+DPD) in both the first and second mortgage portfolios.
Loans with FICO scores of less than 620 exhibit significantly higher
delinquencies than in any other FICO band, particularly on a refreshed basis.
This difference is most noticeable for loans with refreshed FICOs of less than
620 and LTVs of at least 90%: first mortgages had a 90+DPD of 25.4%, while
second mortgages were at 24.5%.
Delinquencies: 90+DPD—First Mortgages
LTV 80%
80%<LTV<90%
LTV 90%
FICO<620
6.9%
10.4%
18.4%
620 FICO
<660
6.2%
7.1%
11.2%
FICO 660
3.4%
3.7%
5.9%
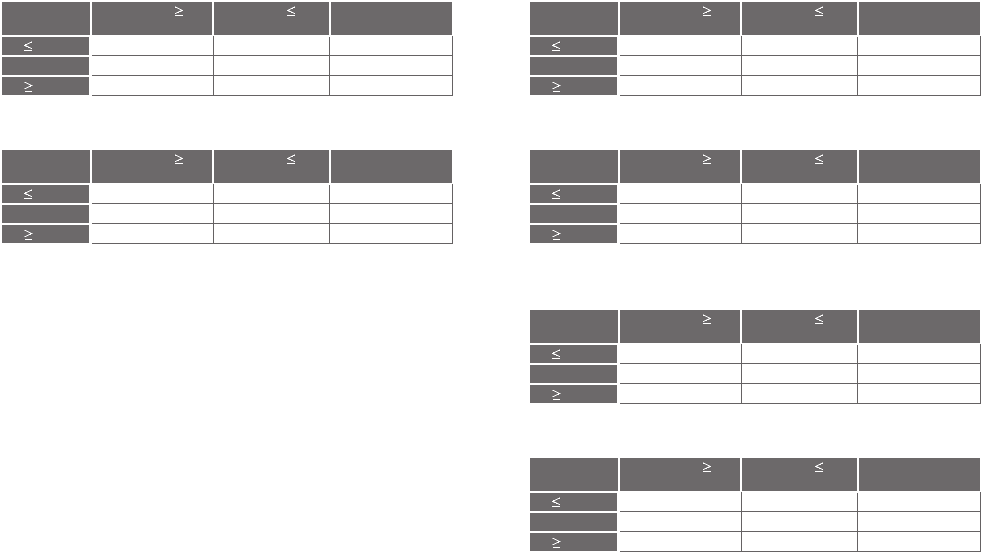
AT
ORIGINATION
LTV 80%
80%<LTV<90%
LTV 90%
FICO<620
13.6%
19.2%
25.4%
620 FICO
<660
2.6%
3.4%
6.0%
FICO 660
0.3%
0.9%
1.9%
REFRESHED
Note: 90+DPD are based on balances referenced in the tables above.
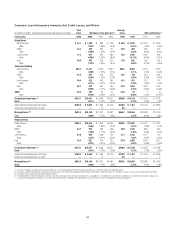
Delinquencies: 90+DPD—Second Mortgages
LTV 80%
80%<LTV<90%
LTV 90%
FICO<620
2.8%
6.8%
5.0%
620 FICO
<660
2.6%
4.2%
4.3%
FICO 660
0.9%
2.8%
4.7%
AT
ORIGINATION
LTV 80%
80%<LTV<90%
LTV 90%
FICO<620
10.2%
13.9%
24.5%
620 FICO
<660
1.2%
1.6%
5.8%
FICO 660
0.1%
0.1%
0.9%
REFRESHED
Note: 90+DPD are based on balances referenced in the tables above. Second mortgages with FICOs below
620 at origination are less than 1% of the total, and the Company provides 90+DPD delinquency rates as
a measure of their performance.
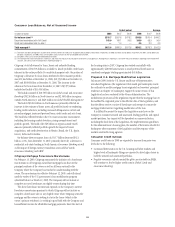
In light of increased delinquencies in the U.S. Consumer mortgage
portfolios, during 2008 the Company expanded its allowance for loan losses
related to these portfolios by approximately $4.5 billion. As of the end of
2008, the coincident reserve coverage ratio for the first and second mortgage
portfolios was at 15.7 months and 13.8 months, respectively.
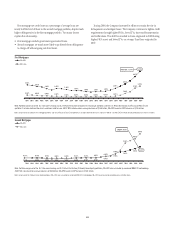
The following charts detail the quarterly trends in delinquencies for the
Company’s first and second U.S. Consumer mortgage portfolios.
As set forth in the chart, delinquencies have increased substantially:
• The first mortgage delinquency trend shows that year-end delinquency
levels have more than doubled 2003 levels. A further breakout of the FICO
below 620 segment indicates that delinquencies in this segment are two
times higher than in the overall first mortgage portfolio.
• Delinquency rates in the second mortgage portfolio are at historically
high levels, particularly in the 90% or higher LTV segment. This segment
has a year-end delinquency rate almost twice as high as the rate for the
overall second mortgage portfolio.
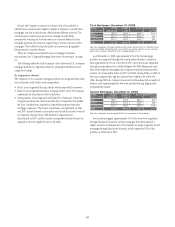
Net credit losses have also increased significantly. First mortgages’ net
credit losses as a percentage of average loans increased by close to 4.5 times
since the end of 2007, while that of second mortgages tripled.
61