Citibank 2008 Annual Report Download - page 183
Download and view the complete annual report
Please find page 183 of the 2008 Citibank annual report below. You can navigate through the pages in the report by either clicking on the pages listed below, or by using the keyword search tool below to find specific information within the annual report.-
 1
1 -
2
-
3
-
4
-
5
-
6
-
7
-
8
-
9
-
10
-
11
-
12
-
13
-
14
-
15
-
16
-
17
-
18
-
19
-
20
-
21
-
22
-
23
-
24
-
25
-
26
-
27
-
28
-
29
-
30
-
31
-
32
-
33
-
34
-
35
-
36
-
37
-
38
-
39
-
40
-
41
-
42
-
43
-
44
-
45
-
46
-
47
-
48
-
49
-
50
-
51
-
52
-
53
-
54
-
55
-
56
-
57
-
58
-
59
-
60
-
61
-
62
-
63
-
64
-
65
-
66
-
67
-
68
-
69
-
70
-
71
-
72
-
73
-
74
-
75
-
76
-
77
-
78
-
79
-
80
-
81
-
82
-
83
-
84
-
85
-
86
-
87
-
88
-
89
-
90
-
91
-
92
-
93
-
94
-
95
-
96
-
97
-
98
-
99
-
100
-
101
-
102
-
103
-
104
-
105
-
106
-
107
-
108
-
109
-
110
-
111
-
112
-
113
-
114
-
115
-
116
-
117
-
118
-
119
-
120
-
121
-
122
-
123
-
124
-
125
-
126
-
127
-
128
-
129
-
130
-
131
-
132
-
133
-
134
-
135
-
136
-
137
-
138
-
139
-
140
-
141
-
142
-
143
-
144
-
145
-
146
-
147
-
148
-
149
-
150
-
151
-
152
-
153
-
154
-
155
-
156
-
157
-
158
-
159
-
160
-
161
-
162
-
163
-
164
-
165
-
166
-
167
-
168
-
169
-
170
-
171
-
172
-
 173
173 -
 174
174 -
 175
175 -
 176
176 -
 177
177 -
 178
178 -
 179
179 -
 180
180 -
 181
181 -
 182
182 -
 183
183 -
 184
184 -
 185
185 -
 186
186 -
 187
187 -
 188
188 -
 189
189 -
 190
190 -
 191
191 -
 192
192 -
 193
193 -
194
-
195
-
196
-
197
-
198
-
199
-
200
-
201
-
202
-
203
-
204
-
205
-
206
-
207
-
208
-
209
-
210
-
211
-
212
-
213
-
214
-
215
-
216
-
217
-
218
-
219
-
220
-
221
-
222
-
223
-
224
-
225
-
226
-
227
-
228
-
229
-
230
-
231
-
232
-
233
-
234
-
235
-
236
-
237
-
238
-
239
-
240
-
241
-
242
-
243
-
244
-
245
-
246
-
247
-
248
-
249
-
250
-
251
-
252
 |
 |
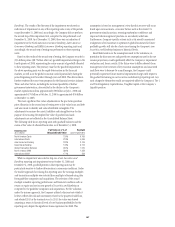
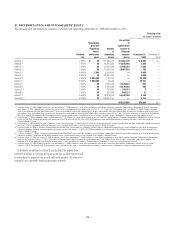
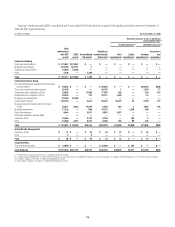
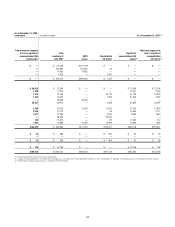
As of December 31, 2008
(continued) In millions of dollars As of December 31, 2007 (1)
Total maximum exposure
to loss in significant
unconsolidated VIEs
(continued)(3)
Total
involvement
with SPEs
QSPE
assets
Consolidated
VIE assets
Significant
unconsolidated VIE
assets (2)
Maximum exposure to
loss in significant
unconsolidated
VIE assets (3)
$— $ 125,109 $125,109 $ — $ — $ —
—550,965 550,902 63 — —
—14,882 14,882 — — —
—1,420 — 1,420 — —
$— $ 692,376 $690,893 $ 1,483 $ — $ —
$ 59,635 $ 72,558 $ — $ — $ 72,558 $ 72,558
1,399 27,021 — — 27,021 2,154
1,473 74,106 — 22,312 51,794 13,979
1,444 23,227 — 1,353 21,874 4,762
—92,263 92,263 — — —
28,231 96,072 — 4,468 91,604 34,297
7,884 50,129 10,556 17,003 22,570 17,843
3,536 13,715 — 53 13,662 2,711
1,537 12,383 — 2,790 9,593 1,643
—58,543 — 58,543 — —
158 11,422 — 140 11,282 212
1,262 37,895 14,526 12,809 10,560 1,882
$106,559 $ 569,334 $117,345 $119,471 $332,518 $152,041
$32 $ 656 $ — $ 604 $ 52 $ 45
——————
$32 $ 656 $ — $ 604 $ 52 $ 45
$ 162 $ 23,756 $ — $ — $ 23,756 $ 162
$106,753 $1,286,122 $808,238 $121,558 $356,326 $152,248
(1) Reclassified to conform to the current period’s presentation.
(2) A significant unconsolidated VIE is an entity where the Company has any variable interest considered to be significant as discussed on page 175, regardless of the likelihood of loss or the notional amount of exposure.
(3) The definition of maximum exposure to loss is included in the text that follows.
177