Citibank 2008 Annual Report Download - page 76
Download and view the complete annual report
Please find page 76 of the 2008 Citibank annual report below. You can navigate through the pages in the report by either clicking on the pages listed below, or by using the keyword search tool below to find specific information within the annual report.-
 1
1 -
2
-
3
-
4
-
5
-
6
-
7
-
8
-
9
-
10
-
11
-
12
-
13
-
14
-
15
-
16
-
17
-
18
-
19
-
20
-
21
-
22
-
23
-
24
-
25
-
26
-
27
-
28
-
29
-
30
-
31
-
32
-
33
-
34
-
35
-
36
-
37
-
38
-
39
-
40
-
41
-
42
-
43
-
44
-
45
-
46
-
47
-
48
-
49
-
50
-
51
-
52
-
53
-
54
-
55
-
56
-
57
-
58
-
59
-
60
-
61
-
62
-
63
-
64
-
65
-
 66
66 -
 67
67 -
 68
68 -
 69
69 -
 70
70 -
 71
71 -
 72
72 -
 73
73 -
 74
74 -
 75
75 -
 76
76 -
 77
77 -
 78
78 -
 79
79 -
 80
80 -
 81
81 -
 82
82 -
 83
83 -
 84
84 -
 85
85 -
 86
86 -
87
-
88
-
89
-
90
-
91
-
92
-
93
-
94
-
95
-
96
-
97
-
98
-
99
-
100
-
101
-
102
-
103
-
104
-
105
-
106
-
107
-
108
-
109
-
110
-
111
-
112
-
113
-
114
-
115
-
116
-
117
-
118
-
119
-
120
-
121
-
122
-
123
-
124
-
125
-
126
-
127
-
128
-
129
-
130
-
131
-
132
-
133
-
134
-
135
-
136
-
137
-
138
-
139
-
140
-
141
-
142
-
143
-
144
-
145
-
146
-
147
-
148
-
149
-
150
-
151
-
152
-
153
-
154
-
155
-
156
-
157
-
158
-
159
-
160
-
161
-
162
-
163
-
164
-
165
-
166
-
167
-
168
-
169
-
170
-
171
-
172
-
173
-
174
-
175
-
176
-
177
-
178
-
179
-
180
-
181
-
182
-
183
-
184
-
185
-
186
-
187
-
188
-
189
-
190
-
191
-
192
-
193
-
194
-
195
-
196
-
197
-
198
-
199
-
200
-
201
-
202
-
203
-
204
-
205
-
206
-
207
-
208
-
209
-
210
-
211
-
212
-
213
-
214
-
215
-
216
-
217
-
218
-
219
-
220
-
221
-
222
-
223
-
224
-
225
-
226
-
227
-
228
-
229
-
230
-
231
-
232
-
233
-
234
-
235
-
236
-
237
-
238
-
239
-
240
-
241
-
242
-
243
-
244
-
245
-
246
-
247
-
248
-
249
-
250
-
251
-
252
 |
 |

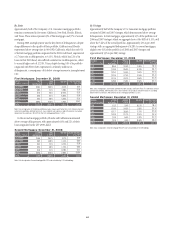
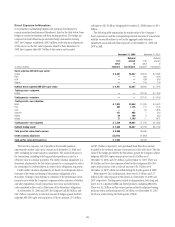
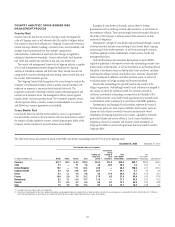
Direct Exposure to Monolines
In its Securities and Banking business, the Company has exposure to
various monoline bond insurers (Monolines), listed in the table below, from
hedges on certain investments and from trading positions. The hedges are
composed of credit default swaps and other hedge instruments. During
2007, the Company established a $967 million credit valuation adjustment
(CVA) reserve on the fair-value exposures related to these Monolines. In
2008, the Company added $5.7 billion to this reserve and recorded
utilizations of $2.4 billion, bringing the December 31, 2008 balance to $4.3
billion.
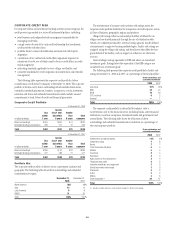
The following table summarizes the market value of the Company’s
direct exposures to and the corresponding notional amounts of transactions
with the various Monolines as well as the aggregate credit valuation
adjustment associated with these exposures as of December 31, 2008 and
2007 in S&B:
December 31, 2008 December 31, 2007
In millions of dollars
Fair-
value
exposure
Notional
amount
of
transactions
Fair-
value
exposure
Notional
amount
of
transactions
Direct subprime ABS CDO super senior:
Ambac $ 4,461 $5,357 $1,815 $ 5,485
FGIC ——909 1,460
ACA ——438 600
Radian ——100 100
Subtotal direct subprime ABS CDO super senior $ 4,461 $5,357 $3,262 $ 7,645
Trading assets—subprime:
Ambac ——$1,150 $ 1,400
Trading assets—subprime ——$1,150 $ 1,400
Trading assets—non-subprime:
MBIA $ 1,924 $4,040 $ 395 $ 5,620
FSA 204 1,126 121 1,126
ACA ——50 1,925
Assured 141 465 7 340
Radian 58 150 5 350
Ambac 21 1,106 — 1,971
Trading assets—non-subprime $ 2,348 $6,887 $ 578 $11,332
Subtotal trading assets $ 2,348 $6,887 $1,728 $12,732
Total gross fair-value direct exposure $ 6,809 $4,990
Credit valuation adjustment $(4,279) $ (967)
Total net fair-value direct exposure $ 2,530 $4,023
The fair-value exposure, net of payable and receivable positions,
represents the market value of the contract as of December 31, 2008 and
2007, excluding the credit valuation adjustment. The notional amount of
the transactions, including both long and short positions, is used as a
reference value to calculate payments. The credit valuation adjustment is a
downward adjustment to the fair-value exposure to a counterparty to reflect
the counterparty’s creditworthiness in respect of the obligations in question.
Credit market valuation adjustments are based on credit spreads and on
estimates of the terms and timing of the payment obligations of the
Monolines. Timing in turn depends on estimates of the performance of the
transactions to which the Company’s exposure relates, estimates of whether
and when liquidation of such transactions may occur and other factors,
each considered in the context of the terms of the Monolines’ obligations.
As of December 31, 2008 and 2007, the Company had $6.9 billion and
$10.5 billion, respectively, in notional amount of hedges against its direct
subprime ABS CDO super senior positions. Of those amounts, $5.3 billion
and $7.5 billion, respectively, were purchased from Monolines and are
included in the notional amount of transactions in the table above. The fair
value of the hedges provided by the Monolines against the Company’s direct
subprime ABS CDO super senior positions was $4.5 billion as of
December 31, 2008, and $3.3 billion as of December 31, 2007. There was
$0.9 billion net fair-value exposure related to direct subprime ABS CDO
super senior positions with a notional amount of $1.5 billion as of
December 31, 2007, which was settled during the fourth quarter of 2008.
With respect to Citi’s trading assets, there were $2.3 billion and $1.7
billion of fair-value exposure to Monolines as of December 31, 2008 and
2007, respectively. Trading assets include trading positions, both long and
short, in U.S. subprime RMBS and related products, including ABS CDOs.
There was $1.2 billion net fair-value exposure related to subprime trading
positions with a notional amount of $1.4 billion as of December 31, 2007,
which was settled during the third quarter of 2008.
70