Citibank 2008 Annual Report Download - page 127
Download and view the complete annual report
Please find page 127 of the 2008 Citibank annual report below. You can navigate through the pages in the report by either clicking on the pages listed below, or by using the keyword search tool below to find specific information within the annual report.-
 1
1 -
2
-
3
-
4
-
5
-
6
-
7
-
8
-
9
-
10
-
11
-
12
-
13
-
14
-
15
-
16
-
17
-
18
-
19
-
20
-
21
-
22
-
23
-
24
-
25
-
26
-
27
-
28
-
29
-
30
-
31
-
32
-
33
-
34
-
35
-
36
-
37
-
38
-
39
-
40
-
41
-
42
-
43
-
44
-
45
-
46
-
47
-
48
-
49
-
50
-
51
-
52
-
53
-
54
-
55
-
56
-
57
-
58
-
59
-
60
-
61
-
62
-
63
-
64
-
65
-
66
-
67
-
68
-
69
-
70
-
71
-
72
-
73
-
74
-
75
-
76
-
77
-
78
-
79
-
80
-
81
-
82
-
83
-
84
-
85
-
86
-
87
-
88
-
89
-
90
-
91
-
92
-
93
-
94
-
95
-
96
-
97
-
98
-
99
-
100
-
101
-
102
-
103
-
104
-
105
-
106
-
107
-
108
-
109
-
110
-
111
-
112
-
113
-
114
-
115
-
116
-
 117
117 -
 118
118 -
 119
119 -
 120
120 -
 121
121 -
 122
122 -
 123
123 -
 124
124 -
 125
125 -
 126
126 -
 127
127 -
 128
128 -
 129
129 -
 130
130 -
 131
131 -
 132
132 -
 133
133 -
 134
134 -
 135
135 -
 136
136 -
 137
137 -
138
-
139
-
140
-
141
-
142
-
143
-
144
-
145
-
146
-
147
-
148
-
149
-
150
-
151
-
152
-
153
-
154
-
155
-
156
-
157
-
158
-
159
-
160
-
161
-
162
-
163
-
164
-
165
-
166
-
167
-
168
-
169
-
170
-
171
-
172
-
173
-
174
-
175
-
176
-
177
-
178
-
179
-
180
-
181
-
182
-
183
-
184
-
185
-
186
-
187
-
188
-
189
-
190
-
191
-
192
-
193
-
194
-
195
-
196
-
197
-
198
-
199
-
200
-
201
-
202
-
203
-
204
-
205
-
206
-
207
-
208
-
209
-
210
-
211
-
212
-
213
-
214
-
215
-
216
-
217
-
218
-
219
-
220
-
221
-
222
-
223
-
224
-
225
-
226
-
227
-
228
-
229
-
230
-
231
-
232
-
233
-
234
-
235
-
236
-
237
-
238
-
239
-
240
-
241
-
242
-
243
-
244
-
245
-
246
-
247
-
248
-
249
-
250
-
251
-
252
 |
 |

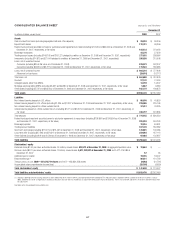
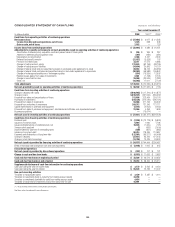
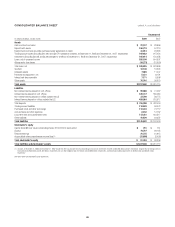
CONSOLIDATED BALANCE SHEET Citibank, N.A. and Subsidiaries
December 31
In millions of dollars, except shares 2008 2007
Assets
Cash and due from banks $ 22,107 $ 28,966
Deposits with banks 156,774 57,216
Federal funds sold and securities purchased under agreements to resell 41,613 23,563
Trading account assets (including $12,092 and $22,716 pledged to creditors at December 31, 2008 and December 31, 2007, respectively) 197,052 215,454
Investments (including $3,028 and $3,099 pledged to creditors at December 31, 2008 and December 31, 2007, respectively) 165,914 150,058
Loans, net of unearned income 555,198 644,597
Allowance for loan losses (18,273) (10,659)
Total loans, net $ 536,925 $ 633,938
Goodwill 10,148 19,294
Intangible assets 7,689 11,007
Premises and equipment, net 5,331 8,191
Interest and fees receivable 7,171 8,958
Other assets 76,316 95,070
Total assets $1,227,040 $1,251,715
Liabilities
Non-interest-bearing deposits in U.S. offices $ 59,808 $ 41,032
Interest-bearing deposits in U.S. offices 180,737 186,080
Non-interest-bearing deposits in offices outside the U.S. 33,769 38,775
Interest-bearing deposits in offices outside the U.S. 480,984 516,517
Total deposits $ 755,298 $ 782,404
Trading account liabilities 110,599 59,472
Purchased funds and other borrowings 116,333 74,112
Accrued taxes and other expenses 8,192 12,752
Long-term debt and subordinated notes 113,381 184,317
Other liabilities 41,879 39,352
Total liabilities $1,145,682 $1,152,409
Stockholder’s equity
Capital stock ($20 par value) outstanding shares: 37,534,553 in each period $ 751 $ 751
Surplus 74,767 69,135
Retained earnings 21,735 31,915
Accumulated other comprehensive income (loss) (1) (15,895) (2,495)
Total stockholder’s equity $ 81,358 $ 99,306
Total liabilities and stockholder’s equity $1,227,040 $1,251,715
(1) Amounts at December 31, 2008 and December 31, 2007 include the after-tax amounts for net unrealized gains (losses) on investment securities of ($8.008) billion and ($1.262) billion, respectively, for foreign currency
translation of ($3.964) billion and $1.687 billion, respectively, for cash flow hedges of ($3,247) billion and ($2.085) billion, respectively, and for pension liability adjustments of ($676) million and ($835) million,
respectively.
See Notes to the Consolidated Financial Statements.
121