Citibank 2008 Annual Report Download - page 227
Download and view the complete annual report
Please find page 227 of the 2008 Citibank annual report below. You can navigate through the pages in the report by either clicking on the pages listed below, or by using the keyword search tool below to find specific information within the annual report.-
 1
1 -
2
-
3
-
4
-
5
-
6
-
7
-
8
-
9
-
10
-
11
-
12
-
13
-
14
-
15
-
16
-
17
-
18
-
19
-
20
-
21
-
22
-
23
-
24
-
25
-
26
-
27
-
28
-
29
-
30
-
31
-
32
-
33
-
34
-
35
-
36
-
37
-
38
-
39
-
40
-
41
-
42
-
43
-
44
-
45
-
46
-
47
-
48
-
49
-
50
-
51
-
52
-
53
-
54
-
55
-
56
-
57
-
58
-
59
-
60
-
61
-
62
-
63
-
64
-
65
-
66
-
67
-
68
-
69
-
70
-
71
-
72
-
73
-
74
-
75
-
76
-
77
-
78
-
79
-
80
-
81
-
82
-
83
-
84
-
85
-
86
-
87
-
88
-
89
-
90
-
91
-
92
-
93
-
94
-
95
-
96
-
97
-
98
-
99
-
100
-
101
-
102
-
103
-
104
-
105
-
106
-
107
-
108
-
109
-
110
-
111
-
112
-
113
-
114
-
115
-
116
-
117
-
118
-
119
-
120
-
121
-
122
-
123
-
124
-
125
-
126
-
127
-
128
-
129
-
130
-
131
-
132
-
133
-
134
-
135
-
136
-
137
-
138
-
139
-
140
-
141
-
142
-
143
-
144
-
145
-
146
-
147
-
148
-
149
-
150
-
151
-
152
-
153
-
154
-
155
-
156
-
157
-
158
-
159
-
160
-
161
-
162
-
163
-
164
-
165
-
166
-
167
-
168
-
169
-
170
-
171
-
172
-
173
-
174
-
175
-
176
-
177
-
178
-
179
-
180
-
181
-
182
-
183
-
184
-
185
-
186
-
187
-
188
-
189
-
190
-
191
-
192
-
193
-
194
-
195
-
196
-
197
-
198
-
199
-
200
-
201
-
202
-
203
-
204
-
205
-
206
-
207
-
208
-
209
-
210
-
211
-
212
-
213
-
214
-
215
-
216
-
 217
217 -
 218
218 -
 219
219 -
 220
220 -
 221
221 -
 222
222 -
 223
223 -
 224
224 -
 225
225 -
 226
226 -
 227
227 -
 228
228 -
 229
229 -
 230
230 -
 231
231 -
 232
232 -
 233
233 -
 234
234 -
 235
235 -
 236
236 -
 237
237 -
238
-
239
-
240
-
241
-
242
-
243
-
244
-
245
-
246
-
247
-
248
-
249
-
250
-
251
-
252
 |
 |

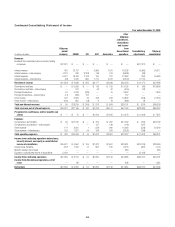
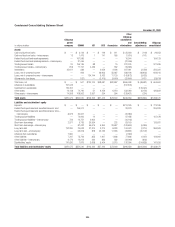
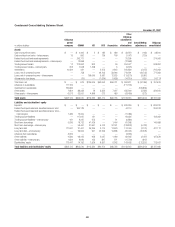
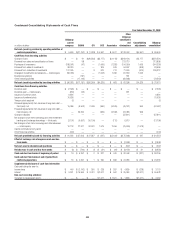
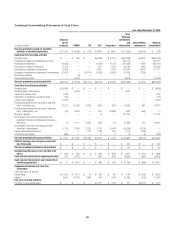
Condensed Consolidating Balance Sheet
December 31, 2007
In millions of dollars
Citigroup
parent
company CGMHI CFI CCC Associates
Other
Citigroup
subsidiaries
and
eliminations
Consolidating
adjustments
Citigroup
consolidated
Assets
Cash and due from banks $ — $ 4,405 $ 2 $ 182 $ 280 $ 33,519 $ (182) $ 38,206
Cash and due from banks—intercompany 19 892 — 139 160 (1,071) (139) —
Federal funds sold and resale agreements — 242,771 — — — 31,295 — 274,066
Federal funds sold and resale agreements—intercompany — 12,668 — — — (12,668) — —
Trading account assets 12 273,662 303 — 30 264,977 — 538,984
Trading account assets—intercompany 262 7,648 1,458 — 5 (9,373) — —
Investments 10,934 431 — 2,275 2,813 200,830 (2,275) 215,008
Loans, net of unearned income — 758 — 49,705 58,944 718,291 (49,705) 777,993
Loans, net of unearned income—intercompany — — 106,645 3,987 12,625 (119,270) (3,987) —
Allowance for loan losses — (79) — (1,639) (1,828) (14,210) 1,639 (16,117)
Total loans, net $ — $ 679 $106,645 $52,053 $69,741 $ 584,811 $ (52,053) $ 761,876
Advances to subsidiaries 111,155 — — — — (111,155) — —
Investments in subsidiaries 165,866 — — — — — (165,866) —
Other assets 7,804 88,333 76 5,552 7,227 255,900 (5,552) 359,340
Other assets—intercompany 6,073 32,051 4,846 273 480 (43,450) (273) —
Total assets $302,125 $663,540 $113,330 $60,474 $80,736 $1,193,615 $(226,340) $2,187,480
Liabilities and stockholders’ equity
Deposits $ — $ — $ — $ — $ — $ 826,230 $ — $ 826,230
Federal funds purchased and securities loaned or sold — 260,129 — — — 44,114 — 304,243
Federal funds purchased and securities loaned or sold—
intercompany 1,486 10,000 — — — (11,486) — —
Trading account liabilities — 117,627 121 — — 64,334 — 182,082
Trading account liabilities—intercompany 161 6,327 375 — 21 (6,884) — —
Short-term borrowings 5,635 16,732 41,429 — 1,444 81,248 — 146,488
Short-term borrowings—intercompany — 59,461 31,691 5,742 37,181 (128,333) (5,742) —
Long-term debt 171,637 31,401 36,395 3,174 13,679 174,000 (3,174) 427,112
Long-term debt—intercompany — 39,606 957 42,293 19,838 (60,401) (42,293) —
Advances from subsidiaries 3,555 — — — — (3,555) — —
Other liabilities 4,580 98,425 268 2,027 1,960 82,645 (2,027) 187,878
Other liabilities—intercompany 1,624 9,640 165 847 271 (11,700) (847) —
Stockholders’ equity 113,447 14,192 1,929 6,391 6,342 143,403 (172,257) 113,447
Total liabilities and stockholders’ equity $302,125 $663,540 $113,330 $60,474 $80,736 $1,193,615 $(226,340) $2,187,480
221