Citibank 2008 Annual Report Download - page 100
Download and view the complete annual report
Please find page 100 of the 2008 Citibank annual report below. You can navigate through the pages in the report by either clicking on the pages listed below, or by using the keyword search tool below to find specific information within the annual report.-
 1
1 -
2
-
3
-
4
-
5
-
6
-
7
-
8
-
9
-
10
-
11
-
12
-
13
-
14
-
15
-
16
-
17
-
18
-
19
-
20
-
21
-
22
-
23
-
24
-
25
-
26
-
27
-
28
-
29
-
30
-
31
-
32
-
33
-
34
-
35
-
36
-
37
-
38
-
39
-
40
-
41
-
42
-
43
-
44
-
45
-
46
-
47
-
48
-
49
-
50
-
51
-
52
-
53
-
54
-
55
-
56
-
57
-
58
-
59
-
60
-
61
-
62
-
63
-
64
-
65
-
66
-
67
-
68
-
69
-
70
-
71
-
72
-
73
-
74
-
75
-
76
-
77
-
78
-
79
-
80
-
81
-
82
-
83
-
84
-
85
-
86
-
87
-
88
-
89
-
 90
90 -
 91
91 -
 92
92 -
 93
93 -
 94
94 -
 95
95 -
 96
96 -
 97
97 -
 98
98 -
 99
99 -
 100
100 -
 101
101 -
 102
102 -
 103
103 -
 104
104 -
 105
105 -
 106
106 -
 107
107 -
 108
108 -
 109
109 -
 110
110 -
111
-
112
-
113
-
114
-
115
-
116
-
117
-
118
-
119
-
120
-
121
-
122
-
123
-
124
-
125
-
126
-
127
-
128
-
129
-
130
-
131
-
132
-
133
-
134
-
135
-
136
-
137
-
138
-
139
-
140
-
141
-
142
-
143
-
144
-
145
-
146
-
147
-
148
-
149
-
150
-
151
-
152
-
153
-
154
-
155
-
156
-
157
-
158
-
159
-
160
-
161
-
162
-
163
-
164
-
165
-
166
-
167
-
168
-
169
-
170
-
171
-
172
-
173
-
174
-
175
-
176
-
177
-
178
-
179
-
180
-
181
-
182
-
183
-
184
-
185
-
186
-
187
-
188
-
189
-
190
-
191
-
192
-
193
-
194
-
195
-
196
-
197
-
198
-
199
-
200
-
201
-
202
-
203
-
204
-
205
-
206
-
207
-
208
-
209
-
210
-
211
-
212
-
213
-
214
-
215
-
216
-
217
-
218
-
219
-
220
-
221
-
222
-
223
-
224
-
225
-
226
-
227
-
228
-
229
-
230
-
231
-
232
-
233
-
234
-
235
-
236
-
237
-
238
-
239
-
240
-
241
-
242
-
243
-
244
-
245
-
246
-
247
-
248
-
249
-
250
-
251
-
252
 |
 |

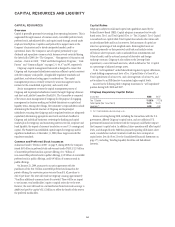
CAPITAL RESOURCES AND LIQUIDITY
CAPITAL RESOURCES
Overview
Capital is generally generated via earnings from operating businesses. This is
augmented through issuance of common stock, convertible preferred stock,
preferred stock, subordinated debt, and equity issued through awards under
employee benefit plans. Capital is used primarily to support assets in the
Company’s businesses and to absorb unexpected market, credit or
operational losses. The Company’s uses of capital, particularly to pay
dividends and repurchase common stock, became severely restricted during
the latter half of 2008. See “The Company,” “Management’s Discussion and
Analysis – Events in 2008,” “TARP and Other Regulatory Programs,” “Risk
Factors” and “Common Equity” on pages 2, 9, 44, 47 and 95, respectively.
Citigroup’s capital management framework is designed to ensure that
Citigroup and its principal subsidiaries maintain sufficient capital consistent
with the Company’s risk profile, all applicable regulatory standards and
guidelines, and external rating agency considerations. The capital
management process is centrally overseen by senior management and is
reviewed at the consolidated, legal entity, and country level.
Senior management oversees the capital management process of
Citigroup and its principal subsidiaries mainly through Citigroup’s Finance
and Asset and Liability Committee (FinALCO). The Committee is composed
of the senior-most management of Citigroup for the purpose of engaging
management in decision-making and related discussions on capital and
liquidity items. Among other things, the Committee’s responsibilities include:
determining the financial structure of Citigroup and its principal
subsidiaries; ensuring that Citigroup and its regulated entities are adequately
capitalized; determining appropriate asset levels and return hurdles for
Citigroup and individual businesses; reviewing the funding and capital
markets plan for Citigroup; and monitoring interest-rate risk, corporate and
bank liquidity, the impact of currency translation on non-U.S. earnings and
capital. The FinALCO has established capital targets for Citigroup and for
significant subsidiaries. At December 31, 2008, these targets exceeded the
regulatory standards.
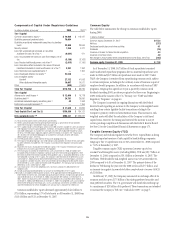
Common and Preferred Stock Issuances
As discussed under “Events in 2008” on page 9, during 2008, the Company
issued $45 billion in preferred stock and warrants under TARP, $12.5 billion
of convertible preferred stock in a private offering, $11.7 billion of
non-convertible preferred stock in public offerings, $3.2 billion of convertible
preferred stock in public offerings, and $4.9 billion of common stock in
public offerings.
On January 23, 2009, pursuant to our prior agreement with the
purchasers of the $12.5 billion convertible preferred stock issued in the
private offering, the conversion price was reset from $31.62 per share to
$26.35 per share. The reset will result in Citigroup’s issuing approximately
79 million additional common shares if converted. There will be no impact
to net income, total stockholders’ equity or capital ratios due to the reset.
However, the reset will result in a reclassification from Retained earnings to
Additional paid-in capital of $1.2 billion to reflect the benefit of the reset to
the preferred stockholders.
Capital Ratios
Citigroup is subject to risk-based capital ratio guidelines issued by the
Federal Reserve Board (FRB). Capital adequacy is measured via two risk-
based ratios, Tier 1 and Total Capital (Tier 1 + Tier 2 Capital). Tier 1 Capital
is considered core capital while Total Capital also includes other items such
as subordinated debt and loan loss reserves. Both measures of capital are
stated as a percentage of risk-weighted assets. Risk-weighted assets are
measured primarily on their perceived credit risk and include certain
off-balance-sheet exposures, such as unfunded loan commitments and
letters of credit, and the notional amounts of derivative and foreign-
exchange contracts. Citigroup is also subject to the Leverage Ratio
requirement, a non-risk-based asset ratio, which is defined as Tier 1 Capital
as a percentage of adjusted average assets.
To be “well capitalized” under federal bank regulatory agency definitions,
a bank holding company must have a Tier 1 Capital Ratio of at least 6%, a
Total Capital Ratio of at least 10%, and a Leverage Ratio of at least 3%, and
not be subject to an FRB directive to maintain higher capital levels.
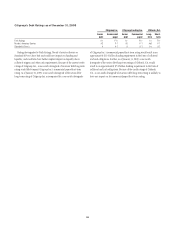
As noted in the following table, Citigroup maintained a “well capitalized”
position during both 2008 and 2007.
Citigroup Regulatory Capital Ratios
At year end 2008 2007
Tier 1 Capital 11.92% 7.12%
Total Capital (Tier 1 and Tier 2) 15.70 10.70
Leverage (1) 6.08 4.03
(1) Tier 1 Capital divided by adjusted average assets.
Events occurring during 2008, including the transactions with the U.S.
government, affected Citigroup’s capital ratios, and any additional U.S.
government financial involvement with the Company could further impact
the Company’s capital ratios. In addition, future operations will affect capital
levels, and changes that the FASB has proposed regarding off-balance-sheet
assets, consolidation and sale treatment could also have an impact on
capital ratios. See also Note 23 to the Consolidated Financial Statements on
page 175, including “Funding Liquidity Facilities and Subordinate
Interests.”
94