Citibank 2008 Annual Report Download - page 184
Download and view the complete annual report
Please find page 184 of the 2008 Citibank annual report below. You can navigate through the pages in the report by either clicking on the pages listed below, or by using the keyword search tool below to find specific information within the annual report.-
 1
1 -
2
-
3
-
4
-
5
-
6
-
7
-
8
-
9
-
10
-
11
-
12
-
13
-
14
-
15
-
16
-
17
-
18
-
19
-
20
-
21
-
22
-
23
-
24
-
25
-
26
-
27
-
28
-
29
-
30
-
31
-
32
-
33
-
34
-
35
-
36
-
37
-
38
-
39
-
40
-
41
-
42
-
43
-
44
-
45
-
46
-
47
-
48
-
49
-
50
-
51
-
52
-
53
-
54
-
55
-
56
-
57
-
58
-
59
-
60
-
61
-
62
-
63
-
64
-
65
-
66
-
67
-
68
-
69
-
70
-
71
-
72
-
73
-
74
-
75
-
76
-
77
-
78
-
79
-
80
-
81
-
82
-
83
-
84
-
85
-
86
-
87
-
88
-
89
-
90
-
91
-
92
-
93
-
94
-
95
-
96
-
97
-
98
-
99
-
100
-
101
-
102
-
103
-
104
-
105
-
106
-
107
-
108
-
109
-
110
-
111
-
112
-
113
-
114
-
115
-
116
-
117
-
118
-
119
-
120
-
121
-
122
-
123
-
124
-
125
-
126
-
127
-
128
-
129
-
130
-
131
-
132
-
133
-
134
-
135
-
136
-
137
-
138
-
139
-
140
-
141
-
142
-
143
-
144
-
145
-
146
-
147
-
148
-
149
-
150
-
151
-
152
-
153
-
154
-
155
-
156
-
157
-
158
-
159
-
160
-
161
-
162
-
163
-
164
-
165
-
166
-
167
-
168
-
169
-
170
-
171
-
172
-
173
-
 174
174 -
 175
175 -
 176
176 -
 177
177 -
 178
178 -
 179
179 -
 180
180 -
 181
181 -
 182
182 -
 183
183 -
 184
184 -
 185
185 -
 186
186 -
 187
187 -
 188
188 -
 189
189 -
 190
190 -
 191
191 -
 192
192 -
 193
193 -
 194
194 -
195
-
196
-
197
-
198
-
199
-
200
-
201
-
202
-
203
-
204
-
205
-
206
-
207
-
208
-
209
-
210
-
211
-
212
-
213
-
214
-
215
-
216
-
217
-
218
-
219
-
220
-
221
-
222
-
223
-
224
-
225
-
226
-
227
-
228
-
229
-
230
-
231
-
232
-
233
-
234
-
235
-
236
-
237
-
238
-
239
-
240
-
241
-
242
-
243
-
244
-
245
-
246
-
247
-
248
-
249
-
250
-
251
-
252
 |
 |

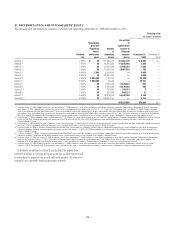
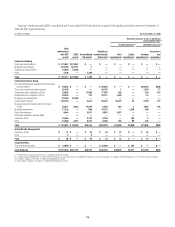
This table does not include:
• certain venture capital investments made by some of the Company’s
private equity subsidiaries, as the Company accounts for these
investments in accordance with the Investment Company Audit Guide;
• certain limited partnerships where the Company is the general partner
and the limited partners have the right to replace the general partner or
liquidate the funds;
• certain investment funds for which the Company provides investment
management services and personal estate trusts for which the Company
provides administrative, trustee and/or investment management services;
• VIEs structured by third parties where the Company holds securities in
inventory. These investments are made on arm’s-length terms; and
• transferred assets to a VIE where the transfer did not qualify as a sale and
where the Company did not have any other involvement that is deemed to
be a variable interest with the VIE. These transfers are accounted for as
secured borrowings by the Company.
The asset balances for consolidated VIEs represent the carrying amounts
of the assets consolidated by the Company. The carrying amount may
represent the amortized cost or the current fair value of the assets depending
on the legal form of the asset (e.g., security or loan) and the Company’s
standard accounting policies for the asset type and line of business.
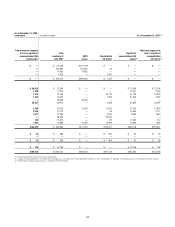
The asset balances for unconsolidated VIEs where the Company has
significant involvement represent the most current information available to
the Company. In most cases, the asset balances represent an amortized cost
basis without regard to impairments in fair value, unless fair value
information is readily available to the Company. For VIEs that obtain asset
exposures synthetically through derivative instruments (for example,
synthetic CDOs), the Company includes the full original notional amount of
the derivative as an asset.
The maximum funded exposure represents the balance sheet carrying
amount of the Company’s investment in the VIE. It reflects the initial
amount of cash invested in the VIE plus any accrued interest and is adjusted
for any impairments in value recognized in earnings and any cash principal
payments received. The maximum exposure of unfunded positions
represents the remaining undrawn committed amount, including liquidity
and credit facilities provided by the Company, or the notional amount of a
derivative instrument considered to be a variable interest, adjusted for any
declines in fair value recognized in earnings. In certain transactions, the
Company has entered into derivative instruments or other arrangements that
are not considered variable interests in the VIE under FIN 46(R) (e.g.,
interest rate swaps, cross-currency swaps, or where the Company is the
purchaser of credit protection under a credit default swap or total return
swap where the Company pays the total return on certain assets to the SPE).
Receivables under such arrangements are not included in the maximum
exposure amounts.
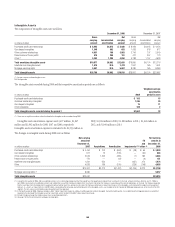
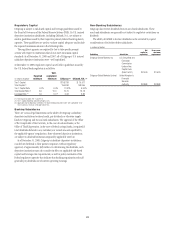
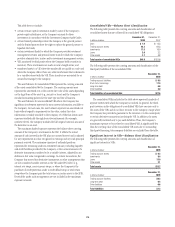
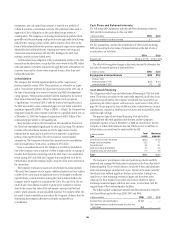
Consolidated VIEs—Balance Sheet Classification
The following table presents the carrying amounts and classification of
consolidated assets that are collateral for consolidated VIE obligations:
In billions of dollars
December 31,
2008
December 31,
2007
Cash $ 1.9 $ 12.3
Trading account assets 22.2 87.3
Investments 17.5 15.0
Loans 2.6 2.2
Other assets 2.7 4.8
Total assets of consolidated VIEs $46.9 $121.6
The following table presents the carrying amounts and classification of the
third-party liabilities of the consolidated VIEs:
In billions of dollars
December 31,
2008
Trading account liabilities $ 0.8
Short-term borrowings 17.0
Long-term debt 6.8
Other liabilities 3.0
Total liabilities of consolidated VIEs $27.6
The consolidated VIEs included in the table above represent hundreds of
separate entities with which the Company is involved. In general, the third-
party investors in the obligations of consolidated VIEs have recourse only to
the assets of the VIEs and do not have recourse to the Company, except where
the Company has provided a guarantee to the investors or is the counterparty
to certain derivative transactions involving the VIE. In addition, the assets
are generally restricted only to pay such liabilities. Thus, the Company’s
maximum exposure to loss related to consolidated VIEs is significantly less
than the carrying value of the consolidated VIE assets due to outstanding
third-party financing. Intercompany liabilities are excluded from the table.
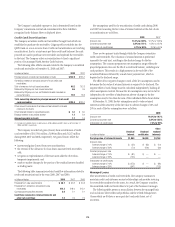
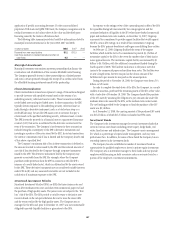
Significant Interest in VIEs—Balance Sheet Classification
The following table presents the carrying amounts and classification of
significant interests in VIEs:
In billions of dollars
December 31,
2008
Trading account assets $ 6.3
Investments 8.4
Loans 15.9
Other assets 3.1
Total assets $33.7
In billions of dollars
December 31,
2008
Trading account liabilities $0.2
Long-term debt 0.4
Other liabilities 0.6
Total liabilities $1.2
178