Citibank 2008 Annual Report Download - page 73
Download and view the complete annual report
Please find page 73 of the 2008 Citibank annual report below. You can navigate through the pages in the report by either clicking on the pages listed below, or by using the keyword search tool below to find specific information within the annual report.-
 1
1 -
2
-
3
-
4
-
5
-
6
-
7
-
8
-
9
-
10
-
11
-
12
-
13
-
14
-
15
-
16
-
17
-
18
-
19
-
20
-
21
-
22
-
23
-
24
-
25
-
26
-
27
-
28
-
29
-
30
-
31
-
32
-
33
-
34
-
35
-
36
-
37
-
38
-
39
-
40
-
41
-
42
-
43
-
44
-
45
-
46
-
47
-
48
-
49
-
50
-
51
-
52
-
53
-
54
-
55
-
56
-
57
-
58
-
59
-
60
-
61
-
62
-
 63
63 -
 64
64 -
 65
65 -
 66
66 -
 67
67 -
 68
68 -
 69
69 -
 70
70 -
 71
71 -
 72
72 -
 73
73 -
 74
74 -
 75
75 -
 76
76 -
 77
77 -
 78
78 -
 79
79 -
 80
80 -
 81
81 -
 82
82 -
 83
83 -
84
-
85
-
86
-
87
-
88
-
89
-
90
-
91
-
92
-
93
-
94
-
95
-
96
-
97
-
98
-
99
-
100
-
101
-
102
-
103
-
104
-
105
-
106
-
107
-
108
-
109
-
110
-
111
-
112
-
113
-
114
-
115
-
116
-
117
-
118
-
119
-
120
-
121
-
122
-
123
-
124
-
125
-
126
-
127
-
128
-
129
-
130
-
131
-
132
-
133
-
134
-
135
-
136
-
137
-
138
-
139
-
140
-
141
-
142
-
143
-
144
-
145
-
146
-
147
-
148
-
149
-
150
-
151
-
152
-
153
-
154
-
155
-
156
-
157
-
158
-
159
-
160
-
161
-
162
-
163
-
164
-
165
-
166
-
167
-
168
-
169
-
170
-
171
-
172
-
173
-
174
-
175
-
176
-
177
-
178
-
179
-
180
-
181
-
182
-
183
-
184
-
185
-
186
-
187
-
188
-
189
-
190
-
191
-
192
-
193
-
194
-
195
-
196
-
197
-
198
-
199
-
200
-
201
-
202
-
203
-
204
-
205
-
206
-
207
-
208
-
209
-
210
-
211
-
212
-
213
-
214
-
215
-
216
-
217
-
218
-
219
-
220
-
221
-
222
-
223
-
224
-
225
-
226
-
227
-
228
-
229
-
230
-
231
-
232
-
233
-
234
-
235
-
236
-
237
-
238
-
239
-
240
-
241
-
242
-
243
-
244
-
245
-
246
-
247
-
248
-
249
-
250
-
251
-
252
 |
 |

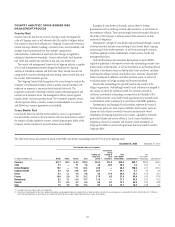
GLOBAL CORPORATE PORTFOLIO REVIEW
Corporate loans are identified as impaired and placed on a non-accrual basis
(cash basis) when it is determined that the payment of interest or principal is
doubtful or when interest or principal is past due for 90 days or more; the
exception is when the loan is well secured and in the process of collection.
Impaired corporate loans are written down to the extent that the principal is
judged to be uncollectible. Impaired collateral-dependent loans are written
down to the lower of cost or collateral value, less disposal costs.
See “Non-Accrual Loans” on page 55 for details on the corporate
non-accrual portfolio.
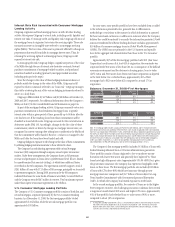
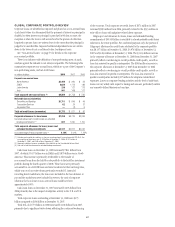
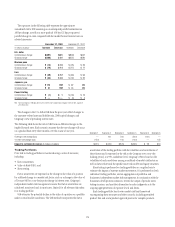
There is no industry-wide definition of non-performing assets. As such,
analysis against the industry is not always comparable. The following table
summarizes corporate non-accrual loans, which are a part of the Company’s
non-performing assets, and net credit losses.
In millions of dollars 2008 2007 2006
Corporate non-accrual loans
North America $2,160 $ 290 $ 59
EMEA 6,630 1,173 186
Latin America 238 127 173
Asia 541 168 117
Total corporate non-accrual loans (1) $9,569 $1,758 $ 535
Net credit losses (recoveries)
Securities and Banking $1,711 $ 649 $ 49
Transaction Services 62 24 27
Corporate/Other —(2) 6
Total net credit losses (recoveries) $1,773 $ 671 $ 82
Corporate allowance for loan losses $7,250 $3,724 $2,934
Corporate allowance for credit losses on unfunded
lending commitments (2) 887 1,250 1,100
Total corporate allowance for loans, leases and
unfunded lending commitments $8,137 $4,974 $4,034
As a percentage of total corporate loans (3) 4.15% 2.01% 1.76%
(1) Excludes purchased distressed loans as they are accreting interest in accordance with SOP 03-3. The
carrying value of these loans was $1,510 million at December 31, 2008, $2,373 million at
December 31, 2007, and $949 million at December 31, 2006.
(2) Represents additional reserves recorded in Other liabilities on the Consolidated Balance Sheet.
(3) Does not include the allowance for unfunded lending commitments.
Cash-basis loans on December 31, 2008 increased $7.811 billion from
2007, of which $5.457 billion was in EMEA and $1.870 billion was in North
America. This increase is primarily attributable to the transfer of
non-accrual loans from the held-for-sale portfolio to the held-for-investment
portfolio during the fourth quarter of 2008. These loans were previously
accounted for on a LOCOM basis and were transferred at their carrying value,
which was net of any write-downs previously recorded. If, instead of
recording direct markdowns, the loans were included in the loan balance at
par and the markdowns were included in reserves, the ratio of corporate
allowance for loan losses to non-accrual loans would have been
approximately 100%.
Cash-basis loans on December 31, 2007 increased $1.223 billion from
2006 primarily due to the impact of subprime activity in the U.K. and U.S.
markets.
Total corporate loans outstanding at December 31, 2008 were $175
billion compared to $186 billion at December 31, 2007.
Total NCL of $1.773 billion in 2008 increased $1.102 billion from 2007,
primarily due to significant write-downs reflecting the continued weakening
of the economy. Total corporate net credit losses of $671 million in 2007
increased $589 million from 2006, primarily related to the $535 million in
write-offs on loans with subprime-related direct exposure.
Citigroup’s total allowance for loans, leases and unfunded lending
commitments of $30.503 billion is available to absorb probable credit losses
inherent in the entire portfolio. For analytical purposes only, the portion of
Citigroup’s allowance for credit losses attributed to the corporate portfolio
was $8.137 billion at December 31, 2008, $4.974 billion at December 31,
2007 and $4.034 billion at December 31, 2006. The $3.163 billion increase
in the corporate allowance at December 31, 2008 from December 31, 2007
primarily reflects a weakening in overall portfolio credit quality, as well as
loan-loss reserves for specific counterparties. The $940 million increase in
the corporate allowance at December 31, 2007 from December 31, 2006
primarily reflects a weakening in overall portfolio credit quality, as well as
loan-loss reserves for specific counterparties. The loan-loss reserves for
specific counterparties include $327 million for subprime-related direct
exposures. Losses on corporate lending activities and the level of cash-basis
loans can vary widely with respect to timing and amount, particularly within
any narrowly defined business or loan type.
67