Citibank 2008 Annual Report Download - page 35
Download and view the complete annual report
Please find page 35 of the 2008 Citibank annual report below. You can navigate through the pages in the report by either clicking on the pages listed below, or by using the keyword search tool below to find specific information within the annual report.-
 1
1 -
2
-
3
-
4
-
5
-
6
-
7
-
8
-
9
-
10
-
11
-
12
-
13
-
14
-
15
-
16
-
17
-
18
-
19
-
20
-
21
-
22
-
23
-
24
-
 25
25 -
 26
26 -
 27
27 -
 28
28 -
 29
29 -
 30
30 -
 31
31 -
 32
32 -
 33
33 -
 34
34 -
 35
35 -
 36
36 -
 37
37 -
 38
38 -
 39
39 -
 40
40 -
 41
41 -
 42
42 -
 43
43 -
 44
44 -
 45
45 -
46
-
47
-
48
-
49
-
50
-
51
-
52
-
53
-
54
-
55
-
56
-
57
-
58
-
59
-
60
-
61
-
62
-
63
-
64
-
65
-
66
-
67
-
68
-
69
-
70
-
71
-
72
-
73
-
74
-
75
-
76
-
77
-
78
-
79
-
80
-
81
-
82
-
83
-
84
-
85
-
86
-
87
-
88
-
89
-
90
-
91
-
92
-
93
-
94
-
95
-
96
-
97
-
98
-
99
-
100
-
101
-
102
-
103
-
104
-
105
-
106
-
107
-
108
-
109
-
110
-
111
-
112
-
113
-
114
-
115
-
116
-
117
-
118
-
119
-
120
-
121
-
122
-
123
-
124
-
125
-
126
-
127
-
128
-
129
-
130
-
131
-
132
-
133
-
134
-
135
-
136
-
137
-
138
-
139
-
140
-
141
-
142
-
143
-
144
-
145
-
146
-
147
-
148
-
149
-
150
-
151
-
152
-
153
-
154
-
155
-
156
-
157
-
158
-
159
-
160
-
161
-
162
-
163
-
164
-
165
-
166
-
167
-
168
-
169
-
170
-
171
-
172
-
173
-
174
-
175
-
176
-
177
-
178
-
179
-
180
-
181
-
182
-
183
-
184
-
185
-
186
-
187
-
188
-
189
-
190
-
191
-
192
-
193
-
194
-
195
-
196
-
197
-
198
-
199
-
200
-
201
-
202
-
203
-
204
-
205
-
206
-
207
-
208
-
209
-
210
-
211
-
212
-
213
-
214
-
215
-
216
-
217
-
218
-
219
-
220
-
221
-
222
-
223
-
224
-
225
-
226
-
227
-
228
-
229
-
230
-
231
-
232
-
233
-
234
-
235
-
236
-
237
-
238
-
239
-
240
-
241
-
242
-
243
-
244
-
245
-
246
-
247
-
248
-
249
-
250
-
251
-
252
 |
 |

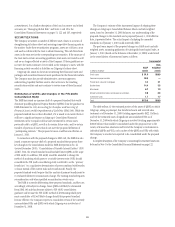
GLOBAL CARDS
In millions of dollars 2008 2007 2006
% Change
2008 vs. 2007
% Change
2007 vs. 2006
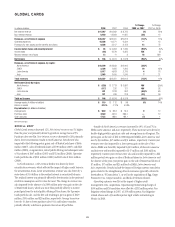
Net interest revenue $11,267 $10,682 $ 8,725 5% 22%
Non-interest revenue 8,940 12,369 11,087 (28) 12
Revenues, net of interest expense $20,207 $23,051 $19,812 (12)% 16%
Operating expenses 10,556 10,571 9,324 —13
Provisions for loan losses and for benefits and claims 9,556 5,517 3,152 73 75
Income before taxes and minority interest $ 95 $ 6,963 $ 7,336 (99)% (5)%
Income taxes (84) 2,278 2,355 NM (3)
Minority interest, net of taxes 13 11 3 18 NM
Net income $ 166 $ 4,674 $ 4,978 (96)% (6)%
Revenues, net of interest expense, by region:
North America $10,299 $13,893 $13,905 (26)% —
EMEA 2,326 1,955 1,205 19 62%
Latin America 5,017 4,803 2,726 476
Asia 2,565 2,400 1,976 721
Total revenues $20,207 $23,051 $19,812 (12)% 16%
Net income (loss) by region:
North America $ (529) $ 2,713 $ 3,887 NM (30)%
EMEA (117) 232 121 NM 92
Latin America 491 1,233 652 (60)% 89
Asia 321 496 318 (35) 56
Total net income $ 166 $ 4,674 $ 4,978 (96)% (6)%
Average assets (in billions of dollars) $ 119 $ 112 $ 98 6% 14%
Return on assets 0.14% 4.17% 5.08%
Key indicators (in billions of dollars)
Average loans $ 90.0 $ 82.3 $ 73.6 912
Purchase sales 436.0 434.9 389.0 —12
Open accounts 175.5 188.6 186.1 (7) 1
NM Not meaningful.
2008 vs. 2007
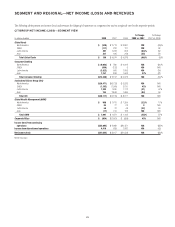
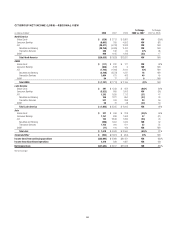
Global Cards revenue decreased 12%. Net interest revenue was 5% higher
than the prior year primarily driven by growth in average loans of 9%.
Purchase sales were flat. Non-interest revenue decreased by 28% primarily
due to lower securitization results in North America. Results were also
impacted by the following pretax gains: sale of MasterCard shares of $466
million (2007), sales of Redecard shares of $729 million (2007) and $663
million (2008), reorganization, initial public offering and subsequent sales
of Visa shares of $447 million (2007) and $523 million (2008), Upromise
Cards portfolio sale of $201 million (2008) and DCI sale of $111 million
(2008).
In North America, a 26% revenue decline was driven by lower
securitization revenues, which reflected the impact of higher credit losses in
the securitization trusts. Lower securitization revenue was also driven by a
write-down of $1.6 billion in the residual interest in securitized balances.
The residual interest was primarily affected by deterioration in the projected
credit loss assumption used to value the asset. The change in revenue was
also impacted by the absence of a $393 million prior-year gain on the sale
of MasterCard shares, which was more than partially offset by a current
period gain from the initial public offering of Visa shares, the Upromise
Cards portfolio sale, and the DCI sale resulting in pre-tax gains of $349
million, $201 million and $29 million, respectively. Average loans were
lower by 1% due to lower purchase sales (4%) and balance transfers,
partially offset by a decline in payment rates across all portfolios.
Outside of North America, revenues increased by 19%, 4% and 7% in
EMEA,Latin America and Asia, respectively. These increases were driven by
double-digit growth in purchase sales and average loans in all regions. The
pretax gain on the sale of DCI in 2008 impacted EMEA,Latin America and
Asia by $34 million, $17 million and $31 million, respectively. Current-year
revenues were also impacted by a lower pretax gain on the sale of Visa
shares: EMEA was favorably impacted by $18 million, while Latin America
and Asia were unfavorably impacted by $147 million and $103 million,
respectively. Current-year revenues were also unfavorably impacted by a $66
million pretax lower gain on sales of Redecard shares in Latin America and
the absence of the prior-year pretax gain on the sale of MasterCard shares of
$7 million, $37 million and $21 million for EMEA,Latin America and
Asia, respectively. Results include the impact of foreign currency translation
gains related to the strengthening of local currencies (generally referred to
hereinafter as “FX translation”), as well as the acquisitions of Egg, Grupo
Financiero Uno, Grupo Cuscatlán, and Bank of Overseas Chinese.
Operating expenses were flat as the impact of higher credit
management costs, acquisitions, repositioning/restructuring charges of
$184 million and FX translation were offset by a $292 million pretax Visa
litigation-related charge in 2007, a $159 million pretax Visa litigation-
related release and a $36 million pretax legal vehicle restructuring in
Mexico in 2008.
29